Egyptian vs Immigrants from Albania Male Disability

COMPARE

Egyptian
Race
Ancestry
AfghanAfricanAlaska NativeAlaskan AthabascanAlbanianAleutAlsatianAmericanApacheArabArapahoArgentineanArmenianAssyrian/Chaldean/SyriacAustralianAustrianBahamianBangladeshiBarbadianBasqueBelgianBelizeanBermudanBhutaneseBlackfeetBolivianBrazilianBritishBritish West IndianBulgarianBurmeseCajunCambodianCanadianCape VerdeanCarpatho RusynCelticCentral AmericanCentral American IndianCherokeeCheyenneChickasawChileanChineseChippewaChoctawColombianColvilleComancheCosta RicanCreeCreekCroatianCrowCubanCypriotCzechCzechoslovakianDanishDelawareDominicanDutchDutch West IndianEastern EuropeanEcuadorianEgyptianEnglishEstonianEthiopianEuropeanFijianFilipinoFinnishFrenchFrench American IndianFrench CanadianGermanGerman RussianGhanaianGreekGuamanian/ChamorroGuatemalanGuyaneseHaitianHmongHonduranHopiHoumaHungarianIcelanderIndian (Asian)IndonesianInupiatIranianIraqiIrishIroquoisIsraeliItalianJamaicanJapaneseJordanianKenyanKiowaKoreanLaotianLatvianLebaneseLiberianLithuanianLumbeeLuxembourgerMacedonianMalaysianMalteseMarshalleseMenomineeMexicanMexican American IndianMongolianMoroccanNative HawaiianNavajoNepaleseNew ZealanderNicaraguanNigerianNorthern EuropeanNorwegianOkinawanOsageOttawaPaiutePakistaniPalestinianPanamanianParaguayanPennsylvania GermanPeruvianPimaPolishPortuguesePotawatomiPuebloPuerto RicanPuget Sound SalishRomanianRussianSalvadoranSamoanScandinavianScotch-IrishScottishSeminoleSenegaleseSerbianShoshoneSierra LeoneanSiouxSlavicSlovakSloveneSomaliSouth AfricanSouth AmericanSouth American IndianSoviet UnionSpaniardSpanishSpanish AmericanSpanish American IndianSri LankanSubsaharan AfricanSudaneseSwedishSwissSyrianTaiwaneseThaiTlingit-HaidaTohono O'OdhamTonganTrinidadian and TobagonianTsimshianTurkishU.S. Virgin IslanderUgandanUkrainianUruguayanUteVenezuelanVietnameseWelshWest IndianYakamaYaquiYugoslavianYumanYup'ikZimbabwean
Immigration
NonimmigrantsImmigrantsAfghanistanAfricaArgentinaArmeniaAsiaAustraliaAustriaBahamasBangladeshBarbadosBelarusBelgiumBelizeBoliviaBosnia and HerzegovinaBrazilBulgariaBurma/MyanmarCabo VerdeCambodiaCameroonCanadaCaribbeanCentral AmericaChileChinaColombiaCongoCosta RicaCroatiaCubaCzechoslovakiaDenmarkDominicaDominican RepublicEastern AfricaEastern AsiaEastern EuropeEcuadorEgyptEl SalvadorEnglandEritreaEthiopiaEuropeFijiFranceGermanyGhanaGreeceGrenadaGuatemalaGuyanaHaitiHondurasHong KongHungaryIndiaIndonesiaIranIraqIrelandIsraelItalyJamaicaJapanJordanKazakhstanKenyaKoreaKuwaitLaosLatin AmericaLatviaLebanonLiberiaLithuaniaMalaysiaMexicoMicronesiaMiddle AfricaMoldovaMoroccoNepalNetherlandsNicaraguaNigeriaNorth AmericaNorth MacedoniaNorthern AfricaNorthern EuropeNorwayOceaniaPakistanPanamaPeruPhilippinesPolandPortugalRomaniaRussiaSaudi ArabiaScotlandSenegalSerbiaSierra LeoneSingaporeSomaliaSouth AfricaSouth AmericaSouth Central AsiaSouth Eastern AsiaSouthern EuropeSpainSri LankaSt. Vincent and the GrenadinesSudanSwedenSwitzerlandSyriaTaiwanThailandTrinidad and TobagoTurkeyUgandaUkraineUruguayUzbekistanVenezuelaVietnamWest IndiesWestern AfricaWestern AsiaWestern EuropeYemenZaireZimbabweAzores
Immigrants from Albania
Race
Ancestry
AfghanAfricanAlaska NativeAlaskan AthabascanAlbanianAleutAlsatianAmericanApacheArabArapahoArgentineanArmenianAssyrian/Chaldean/SyriacAustralianAustrianBahamianBangladeshiBarbadianBasqueBelgianBelizeanBermudanBhutaneseBlackfeetBolivianBrazilianBritishBritish West IndianBulgarianBurmeseCajunCambodianCanadianCape VerdeanCarpatho RusynCelticCentral AmericanCentral American IndianCherokeeCheyenneChickasawChileanChineseChippewaChoctawColombianColvilleComancheCosta RicanCreeCreekCroatianCrowCubanCypriotCzechCzechoslovakianDanishDelawareDominicanDutchDutch West IndianEastern EuropeanEcuadorianEnglishEstonianEthiopianEuropeanFijianFilipinoFinnishFrenchFrench American IndianFrench CanadianGermanGerman RussianGhanaianGreekGuamanian/ChamorroGuatemalanGuyaneseHaitianHmongHonduranHopiHoumaHungarianIcelanderIndian (Asian)IndonesianInupiatIranianIraqiIrishIroquoisIsraeliItalianJamaicanJapaneseJordanianKenyanKiowaKoreanLaotianLatvianLebaneseLiberianLithuanianLumbeeLuxembourgerMacedonianMalaysianMalteseMarshalleseMenomineeMexicanMexican American IndianMongolianMoroccanNative HawaiianNavajoNepaleseNew ZealanderNicaraguanNigerianNorthern EuropeanNorwegianOkinawanOsageOttawaPaiutePakistaniPalestinianPanamanianParaguayanPennsylvania GermanPeruvianPimaPolishPortuguesePotawatomiPuebloPuerto RicanPuget Sound SalishRomanianRussianSalvadoranSamoanScandinavianScotch-IrishScottishSeminoleSenegaleseSerbianShoshoneSierra LeoneanSiouxSlavicSlovakSloveneSomaliSouth AfricanSouth AmericanSouth American IndianSoviet UnionSpaniardSpanishSpanish AmericanSpanish American IndianSri LankanSubsaharan AfricanSudaneseSwedishSwissSyrianTaiwaneseThaiTlingit-HaidaTohono O'OdhamTonganTrinidadian and TobagonianTsimshianTurkishU.S. Virgin IslanderUgandanUkrainianUruguayanUteVenezuelanVietnameseWelshWest IndianYakamaYaquiYugoslavianYumanYup'ikZimbabwean
Immigration
NonimmigrantsImmigrantsAfghanistanAfricaAlbaniaArgentinaArmeniaAsiaAustraliaAustriaBahamasBangladeshBarbadosBelarusBelgiumBelizeBoliviaBosnia and HerzegovinaBrazilBulgariaBurma/MyanmarCabo VerdeCambodiaCameroonCanadaCaribbeanCentral AmericaChileChinaColombiaCongoCosta RicaCroatiaCubaCzechoslovakiaDenmarkDominicaDominican RepublicEastern AfricaEastern AsiaEastern EuropeEcuadorEgyptEl SalvadorEnglandEritreaEthiopiaEuropeFijiFranceGermanyGhanaGreeceGrenadaGuatemalaGuyanaHaitiHondurasHong KongHungaryIndiaIndonesiaIranIraqIrelandIsraelItalyJamaicaJapanJordanKazakhstanKenyaKoreaKuwaitLaosLatin AmericaLatviaLebanonLiberiaLithuaniaMalaysiaMexicoMicronesiaMiddle AfricaMoldovaMoroccoNepalNetherlandsNicaraguaNigeriaNorth AmericaNorth MacedoniaNorthern AfricaNorthern EuropeNorwayOceaniaPakistanPanamaPeruPhilippinesPolandPortugalRomaniaRussiaSaudi ArabiaScotlandSenegalSerbiaSierra LeoneSingaporeSomaliaSouth AfricaSouth AmericaSouth Central AsiaSouth Eastern AsiaSouthern EuropeSpainSri LankaSt. Vincent and the GrenadinesSudanSwedenSwitzerlandSyriaTaiwanThailandTrinidad and TobagoTurkeyUgandaUkraineUruguayUzbekistanVenezuelaVietnamWest IndiesWestern AfricaWestern AsiaWestern EuropeYemenZaireZimbabweAzores
Male Disability
Income
Poverty
Unemployment
Labor Participation
Family Structure
Vehicle Availability
Education Level
Disability

Male Disability Comparison

Egyptians

Immigrants from Albania

Exceptional
Good
10.1%
MALE DISABILITY
99.9/ 100
METRIC RATING
27th/ 347
METRIC RANK
11.0%
MALE DISABILITY
74.4/ 100
METRIC RATING
152nd/ 347
METRIC RANK

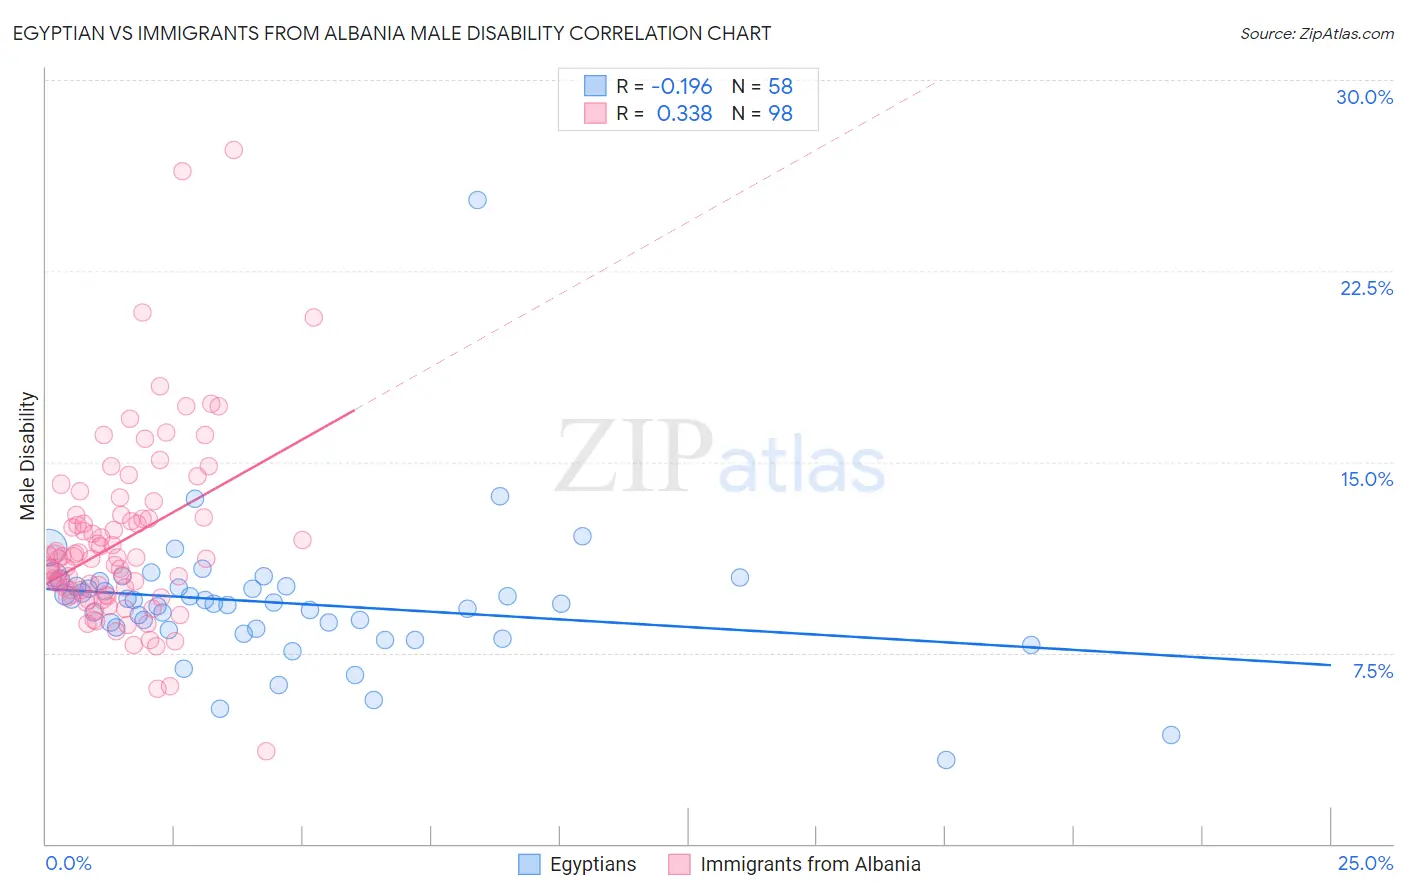
Egyptian vs Immigrants from Albania Male Disability Correlation Chart

The statistical analysis conducted on geographies consisting of 276,912,725 people shows a poor negative correlation between the proportion of Egyptians and percentage of males with a disability in the United States with a correlation coefficient (R) of -0.196 and weighted average of 10.1%. Similarly, the statistical analysis conducted on geographies consisting of 119,394,562 people shows a mild positive correlation between the proportion of Immigrants from Albania and percentage of males with a disability in the United States with a correlation coefficient (R) of 0.338 and weighted average of 11.0%, a difference of 9.5%.
Egyptian vs Immigrants from Albania Male Disability

Male Disability Correlation Summary

MeasurementEgyptianImmigrants from Albania
Minimum3.3%3.6%
Maximum25.3%27.2%
Range22.0%23.6%
Mean9.5%11.9%
Median9.4%11.2%
Interquartile 25% (IQ1)8.5%9.8%
Interquartile 75% (IQ3)10.1%12.8%
Interquartile Range (IQR)1.6%3.0%
Standard Deviation (Sample)2.8%3.6%
Standard Deviation (Population)2.8%3.6%

Similar Demographics by Male Disability

Demographics Similar to Egyptians by Male Disability

In terms of male disability, the demographic groups most similar to Egyptians are Vietnamese (10.1%, a difference of 0.020%), Venezuelan (10.1%, a difference of 0.17%), Immigrants from Egypt (10.1%, a difference of 0.21%), Soviet Union (10.1%, a difference of 0.28%), and Paraguayan (10.1%, a difference of 0.32%).
DemographicsRating | RankMale Disability
Asians
100.0
/100
|
#20
Exceptional
10.0%
Burmese
100.0
/100
|
#21
Exceptional
10.0%
Immigrants | Venezuela
100.0
/100
|
#22
Exceptional
10.0%
Cypriots
100.0
/100
|
#23
Exceptional
10.0%
Immigrants | Asia
100.0
/100
|
#24
Exceptional
10.0%
Immigrants | Malaysia
99.9
/100
|
#25
Exceptional
10.0%
Paraguayans
99.9
/100
|
#26
Exceptional
10.1%
Egyptians
99.9
/100
|
#27
Exceptional
10.1%
Vietnamese
99.9
/100
|
#28
Exceptional
10.1%
Venezuelans
99.9
/100
|
#29
Exceptional
10.1%
Immigrants | Egypt
99.9
/100
|
#30
Exceptional
10.1%
Soviet Union
99.9
/100
|
#31
Exceptional
10.1%
Argentineans
99.9
/100
|
#32
Exceptional
10.1%
Immigrants | Ethiopia
99.9
/100
|
#33
Exceptional
10.2%
Immigrants | Turkey
99.9
/100
|
#34
Exceptional
10.2%

Demographics Similar to Immigrants from Albania by Male Disability

In terms of male disability, the demographic groups most similar to Immigrants from Albania are Cuban (11.0%, a difference of 0.030%), Immigrants from Guatemala (11.0%, a difference of 0.050%), Immigrants from Northern Europe (11.1%, a difference of 0.090%), Immigrants from Moldova (11.1%, a difference of 0.11%), and Immigrants from Denmark (11.0%, a difference of 0.15%).
DemographicsRating | RankMale Disability
Costa Ricans
78.0
/100
|
#145
Good
11.0%
Koreans
77.5
/100
|
#146
Good
11.0%
Immigrants | Croatia
77.3
/100
|
#147
Good
11.0%
Sudanese
77.1
/100
|
#148
Good
11.0%
Immigrants | Denmark
76.4
/100
|
#149
Good
11.0%
Immigrants | Guatemala
75.1
/100
|
#150
Good
11.0%
Cubans
74.9
/100
|
#151
Good
11.0%
Immigrants | Albania
74.4
/100
|
#152
Good
11.0%
Immigrants | Northern Europe
73.2
/100
|
#153
Good
11.1%
Immigrants | Moldova
72.8
/100
|
#154
Good
11.1%
Immigrants | Middle Africa
70.9
/100
|
#155
Good
11.1%
Russians
69.8
/100
|
#156
Good
11.1%
Immigrants | Western Africa
69.2
/100
|
#157
Good
11.1%
Latvians
68.1
/100
|
#158
Good
11.1%
Guatemalans
67.2
/100
|
#159
Good
11.1%