Ecuadorian vs Immigrants from Zimbabwe Family Households
COMPARE
Ecuadorian
Immigrants from Zimbabwe
Family Households
Family Households Comparison
Ecuadorians
Immigrants from Zimbabwe
65.0%
FAMILY HOUSEHOLDS
95.4/ 100
METRIC RATING
115th/ 347
METRIC RANK
63.5%
FAMILY HOUSEHOLDS
2.0/ 100
METRIC RATING
238th/ 347
METRIC RANK
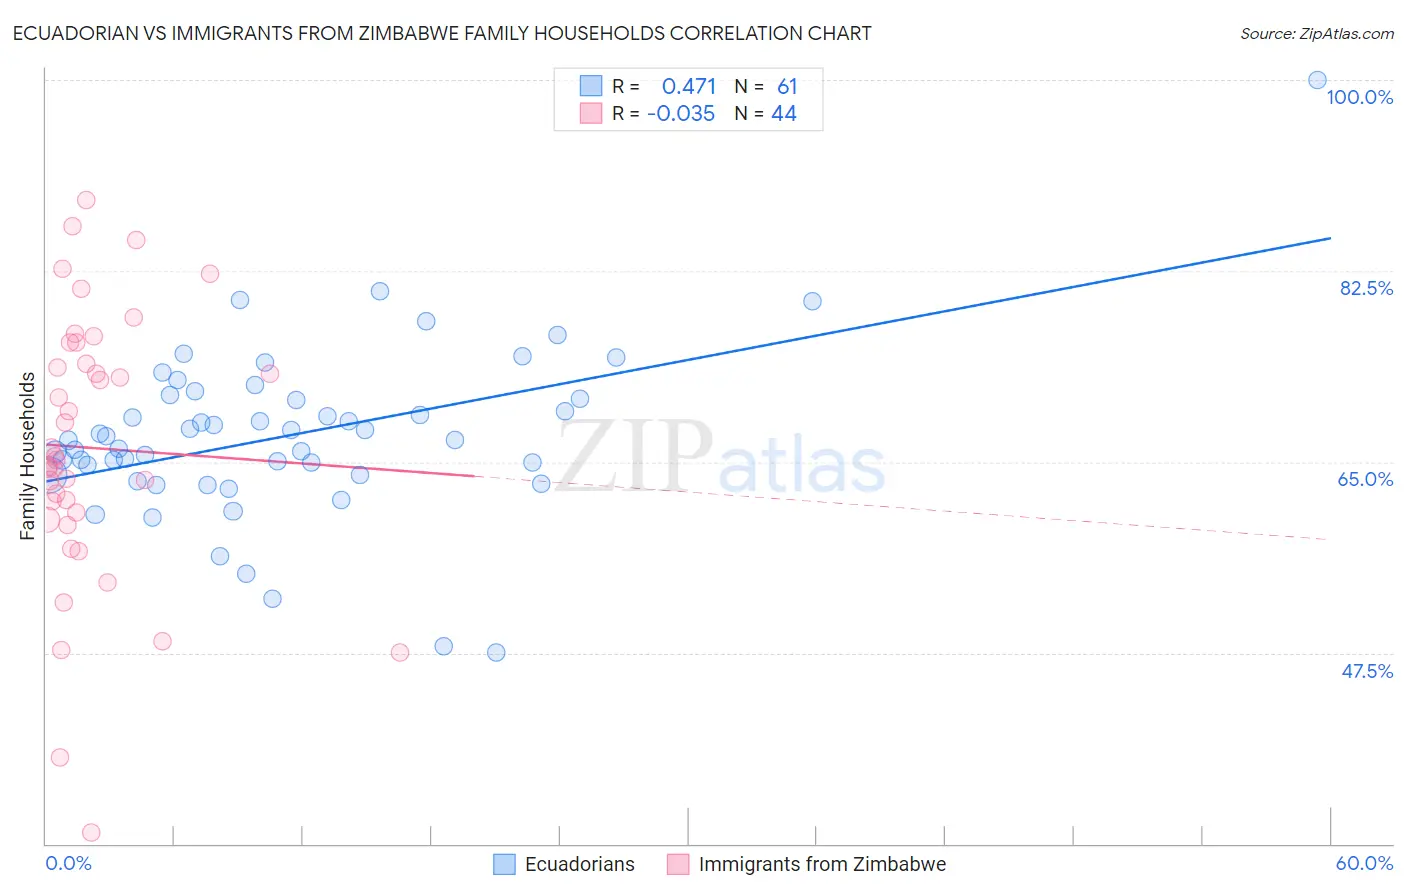
Ecuadorian vs Immigrants from Zimbabwe Family Households Correlation Chart
The statistical analysis conducted on geographies consisting of 317,646,947 people shows a moderate positive correlation between the proportion of Ecuadorians and percentage of family households in the United States with a correlation coefficient (R) of 0.471 and weighted average of 65.0%. Similarly, the statistical analysis conducted on geographies consisting of 117,791,116 people shows no correlation between the proportion of Immigrants from Zimbabwe and percentage of family households in the United States with a correlation coefficient (R) of -0.035 and weighted average of 63.5%, a difference of 2.4%.
Family Households Correlation Summary
| Measurement | Ecuadorian | Immigrants from Zimbabwe |
| Minimum | 47.6% | 31.0% |
| Maximum | 100.0% | 89.0% |
| Range | 52.4% | 57.9% |
| Mean | 67.4% | 66.3% |
| Median | 67.1% | 65.4% |
| Interquartile 25% (IQ1) | 63.8% | 60.0% |
| Interquartile 75% (IQ3) | 71.0% | 75.0% |
| Interquartile Range (IQR) | 7.2% | 15.0% |
| Standard Deviation (Sample) | 7.9% | 12.5% |
| Standard Deviation (Population) | 7.8% | 12.4% |
Similar Demographics by Family Households
Demographics Similar to Ecuadorians by Family Households
In terms of family households, the demographic groups most similar to Ecuadorians are Immigrants from Iraq (65.0%, a difference of 0.0%), Cherokee (65.0%, a difference of 0.010%), Dutch (64.9%, a difference of 0.020%), Argentinean (65.0%, a difference of 0.030%), and Spanish (65.0%, a difference of 0.060%).
| Demographics | Rating | Rank | Family Households |
| Palestinians | 97.2 /100 | #108 | Exceptional 65.1% |
| Immigrants | Guatemala | 96.9 /100 | #109 | Exceptional 65.0% |
| Scandinavians | 96.8 /100 | #110 | Exceptional 65.0% |
| Europeans | 96.8 /100 | #111 | Exceptional 65.0% |
| Immigrants | Jordan | 96.5 /100 | #112 | Exceptional 65.0% |
| Spanish | 96.2 /100 | #113 | Exceptional 65.0% |
| Argentineans | 95.7 /100 | #114 | Exceptional 65.0% |
| Ecuadorians | 95.4 /100 | #115 | Exceptional 65.0% |
| Immigrants | Iraq | 95.4 /100 | #116 | Exceptional 65.0% |
| Cherokee | 95.3 /100 | #117 | Exceptional 65.0% |
| Dutch | 95.1 /100 | #118 | Exceptional 64.9% |
| Immigrants | Eastern Asia | 94.4 /100 | #119 | Exceptional 64.9% |
| Immigrants | Oceania | 94.2 /100 | #120 | Exceptional 64.9% |
| Hungarians | 94.0 /100 | #121 | Exceptional 64.9% |
| Hmong | 93.4 /100 | #122 | Exceptional 64.9% |
Demographics Similar to Immigrants from Zimbabwe by Family Households
In terms of family households, the demographic groups most similar to Immigrants from Zimbabwe are Ghanaian (63.5%, a difference of 0.010%), Comanche (63.5%, a difference of 0.010%), Albanian (63.5%, a difference of 0.020%), Aleut (63.4%, a difference of 0.030%), and South African (63.4%, a difference of 0.030%).
| Demographics | Rating | Rank | Family Households |
| Immigrants | Greece | 2.9 /100 | #231 | Tragic 63.5% |
| Immigrants | Northern Africa | 2.6 /100 | #232 | Tragic 63.5% |
| Immigrants | Armenia | 2.6 /100 | #233 | Tragic 63.5% |
| Finns | 2.3 /100 | #234 | Tragic 63.5% |
| Albanians | 2.2 /100 | #235 | Tragic 63.5% |
| Ghanaians | 2.1 /100 | #236 | Tragic 63.5% |
| Comanche | 2.1 /100 | #237 | Tragic 63.5% |
| Immigrants | Zimbabwe | 2.0 /100 | #238 | Tragic 63.5% |
| Aleuts | 1.9 /100 | #239 | Tragic 63.4% |
| South Africans | 1.9 /100 | #240 | Tragic 63.4% |
| Immigrants | St. Vincent and the Grenadines | 1.9 /100 | #241 | Tragic 63.4% |
| Immigrants | Israel | 1.8 /100 | #242 | Tragic 63.4% |
| Immigrants | Czechoslovakia | 1.8 /100 | #243 | Tragic 63.4% |
| Eastern Europeans | 1.6 /100 | #244 | Tragic 63.4% |
| Immigrants | Dominica | 1.6 /100 | #245 | Tragic 63.4% |