Ecuadorian vs Immigrants from Pakistan Family Households
COMPARE
Ecuadorian
Immigrants from Pakistan
Family Households
Family Households Comparison
Ecuadorians
Immigrants from Pakistan
65.0%
FAMILY HOUSEHOLDS
95.4/ 100
METRIC RATING
115th/ 347
METRIC RANK
67.7%
FAMILY HOUSEHOLDS
100.0/ 100
METRIC RATING
23rd/ 347
METRIC RANK
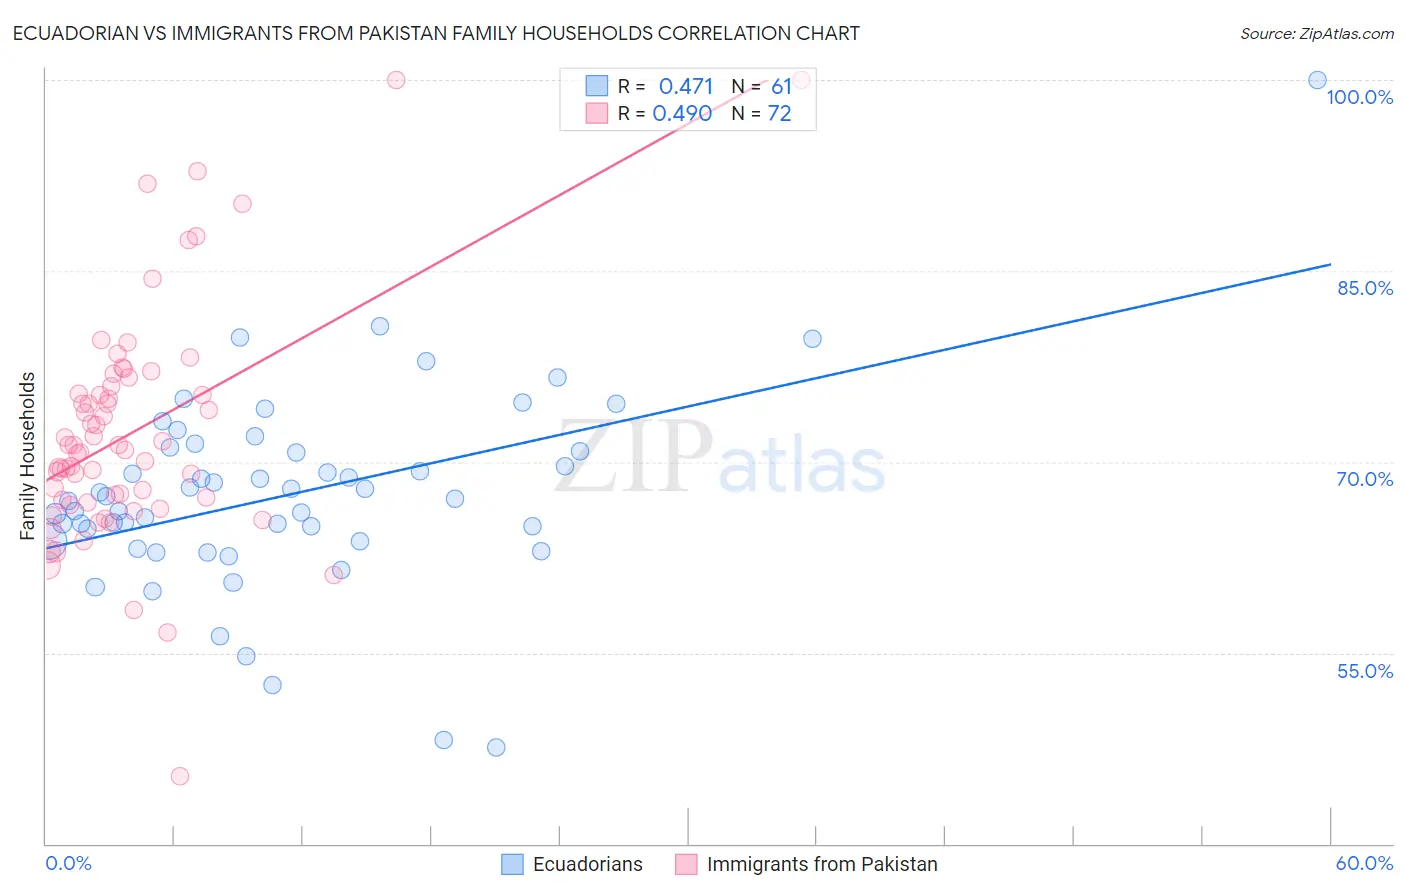
Ecuadorian vs Immigrants from Pakistan Family Households Correlation Chart
The statistical analysis conducted on geographies consisting of 317,646,947 people shows a moderate positive correlation between the proportion of Ecuadorians and percentage of family households in the United States with a correlation coefficient (R) of 0.471 and weighted average of 65.0%. Similarly, the statistical analysis conducted on geographies consisting of 283,802,176 people shows a moderate positive correlation between the proportion of Immigrants from Pakistan and percentage of family households in the United States with a correlation coefficient (R) of 0.490 and weighted average of 67.7%, a difference of 4.2%.
Family Households Correlation Summary
| Measurement | Ecuadorian | Immigrants from Pakistan |
| Minimum | 47.6% | 45.3% |
| Maximum | 100.0% | 100.0% |
| Range | 52.4% | 54.7% |
| Mean | 67.4% | 72.3% |
| Median | 67.1% | 71.1% |
| Interquartile 25% (IQ1) | 63.8% | 66.9% |
| Interquartile 75% (IQ3) | 71.0% | 75.7% |
| Interquartile Range (IQR) | 7.2% | 8.8% |
| Standard Deviation (Sample) | 7.9% | 9.1% |
| Standard Deviation (Population) | 7.8% | 9.1% |
Similar Demographics by Family Households
Demographics Similar to Ecuadorians by Family Households
In terms of family households, the demographic groups most similar to Ecuadorians are Immigrants from Iraq (65.0%, a difference of 0.0%), Cherokee (65.0%, a difference of 0.010%), Dutch (64.9%, a difference of 0.020%), Argentinean (65.0%, a difference of 0.030%), and Spanish (65.0%, a difference of 0.060%).
| Demographics | Rating | Rank | Family Households |
| Palestinians | 97.2 /100 | #108 | Exceptional 65.1% |
| Immigrants | Guatemala | 96.9 /100 | #109 | Exceptional 65.0% |
| Scandinavians | 96.8 /100 | #110 | Exceptional 65.0% |
| Europeans | 96.8 /100 | #111 | Exceptional 65.0% |
| Immigrants | Jordan | 96.5 /100 | #112 | Exceptional 65.0% |
| Spanish | 96.2 /100 | #113 | Exceptional 65.0% |
| Argentineans | 95.7 /100 | #114 | Exceptional 65.0% |
| Ecuadorians | 95.4 /100 | #115 | Exceptional 65.0% |
| Immigrants | Iraq | 95.4 /100 | #116 | Exceptional 65.0% |
| Cherokee | 95.3 /100 | #117 | Exceptional 65.0% |
| Dutch | 95.1 /100 | #118 | Exceptional 64.9% |
| Immigrants | Eastern Asia | 94.4 /100 | #119 | Exceptional 64.9% |
| Immigrants | Oceania | 94.2 /100 | #120 | Exceptional 64.9% |
| Hungarians | 94.0 /100 | #121 | Exceptional 64.9% |
| Hmong | 93.4 /100 | #122 | Exceptional 64.9% |
Demographics Similar to Immigrants from Pakistan by Family Households
In terms of family households, the demographic groups most similar to Immigrants from Pakistan are Sri Lankan (67.7%, a difference of 0.090%), Cuban (67.7%, a difference of 0.12%), Inupiat (67.8%, a difference of 0.17%), Immigrants from South Eastern Asia (67.5%, a difference of 0.28%), and Immigrants from Nicaragua (67.5%, a difference of 0.31%).
| Demographics | Rating | Rank | Family Households |
| Immigrants | Vietnam | 100.0 /100 | #16 | Exceptional 68.2% |
| Chinese | 100.0 /100 | #17 | Exceptional 68.1% |
| Immigrants | Taiwan | 100.0 /100 | #18 | Exceptional 68.0% |
| Samoans | 100.0 /100 | #19 | Exceptional 67.9% |
| Inupiat | 100.0 /100 | #20 | Exceptional 67.8% |
| Cubans | 100.0 /100 | #21 | Exceptional 67.7% |
| Sri Lankans | 100.0 /100 | #22 | Exceptional 67.7% |
| Immigrants | Pakistan | 100.0 /100 | #23 | Exceptional 67.7% |
| Immigrants | South Eastern Asia | 100.0 /100 | #24 | Exceptional 67.5% |
| Immigrants | Nicaragua | 100.0 /100 | #25 | Exceptional 67.5% |
| Immigrants | India | 100.0 /100 | #26 | Exceptional 67.4% |
| Hispanics or Latinos | 100.0 /100 | #27 | Exceptional 67.4% |
| Hawaiians | 100.0 /100 | #28 | Exceptional 67.4% |
| Nicaraguans | 100.0 /100 | #29 | Exceptional 67.4% |
| Immigrants | Peru | 100.0 /100 | #30 | Exceptional 67.2% |