Arapaho vs Immigrants from Zimbabwe Family Households
COMPARE
Arapaho
Immigrants from Zimbabwe
Family Households
Family Households Comparison
Arapaho
Immigrants from Zimbabwe
66.5%
FAMILY HOUSEHOLDS
100.0/ 100
METRIC RATING
46th/ 347
METRIC RANK
63.5%
FAMILY HOUSEHOLDS
2.0/ 100
METRIC RATING
238th/ 347
METRIC RANK
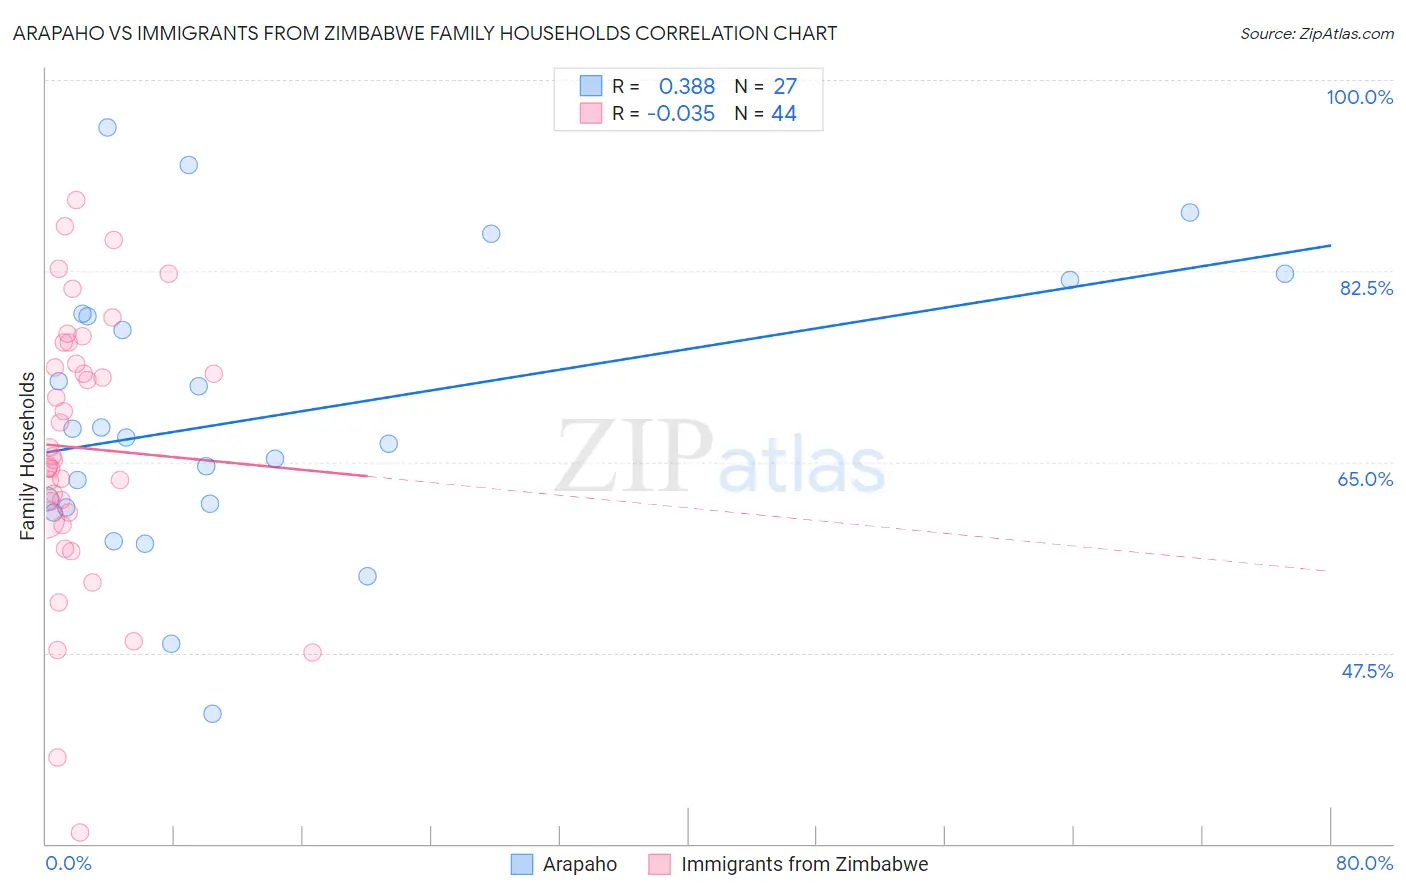
Arapaho vs Immigrants from Zimbabwe Family Households Correlation Chart
The statistical analysis conducted on geographies consisting of 29,778,233 people shows a mild positive correlation between the proportion of Arapaho and percentage of family households in the United States with a correlation coefficient (R) of 0.388 and weighted average of 66.5%. Similarly, the statistical analysis conducted on geographies consisting of 117,791,116 people shows no correlation between the proportion of Immigrants from Zimbabwe and percentage of family households in the United States with a correlation coefficient (R) of -0.035 and weighted average of 63.5%, a difference of 4.8%.
Family Households Correlation Summary
| Measurement | Arapaho | Immigrants from Zimbabwe |
| Minimum | 41.9% | 31.0% |
| Maximum | 95.7% | 89.0% |
| Range | 53.8% | 57.9% |
| Mean | 69.3% | 66.3% |
| Median | 67.2% | 65.4% |
| Interquartile 25% (IQ1) | 60.8% | 60.0% |
| Interquartile 75% (IQ3) | 78.6% | 75.0% |
| Interquartile Range (IQR) | 17.8% | 15.0% |
| Standard Deviation (Sample) | 13.1% | 12.5% |
| Standard Deviation (Population) | 12.9% | 12.4% |
Similar Demographics by Family Households
Demographics Similar to Arapaho by Family Households
In terms of family households, the demographic groups most similar to Arapaho are Venezuelan (66.5%, a difference of 0.020%), Bolivian (66.5%, a difference of 0.030%), Asian (66.5%, a difference of 0.050%), Immigrants from Venezuela (66.4%, a difference of 0.050%), and Apache (66.5%, a difference of 0.090%).
| Demographics | Rating | Rank | Family Households |
| Immigrants | El Salvador | 100.0 /100 | #39 | Exceptional 67.0% |
| Guamanians/Chamorros | 100.0 /100 | #40 | Exceptional 66.6% |
| Immigrants | Bolivia | 100.0 /100 | #41 | Exceptional 66.6% |
| Menominee | 100.0 /100 | #42 | Exceptional 66.5% |
| Apache | 100.0 /100 | #43 | Exceptional 66.5% |
| Asians | 100.0 /100 | #44 | Exceptional 66.5% |
| Venezuelans | 100.0 /100 | #45 | Exceptional 66.5% |
| Arapaho | 100.0 /100 | #46 | Exceptional 66.5% |
| Bolivians | 100.0 /100 | #47 | Exceptional 66.5% |
| Immigrants | Venezuela | 100.0 /100 | #48 | Exceptional 66.4% |
| Immigrants | South Central Asia | 100.0 /100 | #49 | Exceptional 66.4% |
| Navajo | 100.0 /100 | #50 | Exceptional 66.4% |
| Natives/Alaskans | 100.0 /100 | #51 | Exceptional 66.4% |
| Colombians | 100.0 /100 | #52 | Exceptional 66.3% |
| Afghans | 100.0 /100 | #53 | Exceptional 66.3% |
Demographics Similar to Immigrants from Zimbabwe by Family Households
In terms of family households, the demographic groups most similar to Immigrants from Zimbabwe are Ghanaian (63.5%, a difference of 0.010%), Comanche (63.5%, a difference of 0.010%), Albanian (63.5%, a difference of 0.020%), Aleut (63.4%, a difference of 0.030%), and South African (63.4%, a difference of 0.030%).
| Demographics | Rating | Rank | Family Households |
| Immigrants | Greece | 2.9 /100 | #231 | Tragic 63.5% |
| Immigrants | Northern Africa | 2.6 /100 | #232 | Tragic 63.5% |
| Immigrants | Armenia | 2.6 /100 | #233 | Tragic 63.5% |
| Finns | 2.3 /100 | #234 | Tragic 63.5% |
| Albanians | 2.2 /100 | #235 | Tragic 63.5% |
| Ghanaians | 2.1 /100 | #236 | Tragic 63.5% |
| Comanche | 2.1 /100 | #237 | Tragic 63.5% |
| Immigrants | Zimbabwe | 2.0 /100 | #238 | Tragic 63.5% |
| Aleuts | 1.9 /100 | #239 | Tragic 63.4% |
| South Africans | 1.9 /100 | #240 | Tragic 63.4% |
| Immigrants | St. Vincent and the Grenadines | 1.9 /100 | #241 | Tragic 63.4% |
| Immigrants | Israel | 1.8 /100 | #242 | Tragic 63.4% |
| Immigrants | Czechoslovakia | 1.8 /100 | #243 | Tragic 63.4% |
| Eastern Europeans | 1.6 /100 | #244 | Tragic 63.4% |
| Immigrants | Dominica | 1.6 /100 | #245 | Tragic 63.4% |