Cheyenne vs Immigrants from Zimbabwe Family Households
COMPARE
Cheyenne
Immigrants from Zimbabwe
Family Households
Family Households Comparison
Cheyenne
Immigrants from Zimbabwe
63.2%
FAMILY HOUSEHOLDS
0.5/ 100
METRIC RATING
263rd/ 347
METRIC RANK
63.5%
FAMILY HOUSEHOLDS
2.0/ 100
METRIC RATING
238th/ 347
METRIC RANK
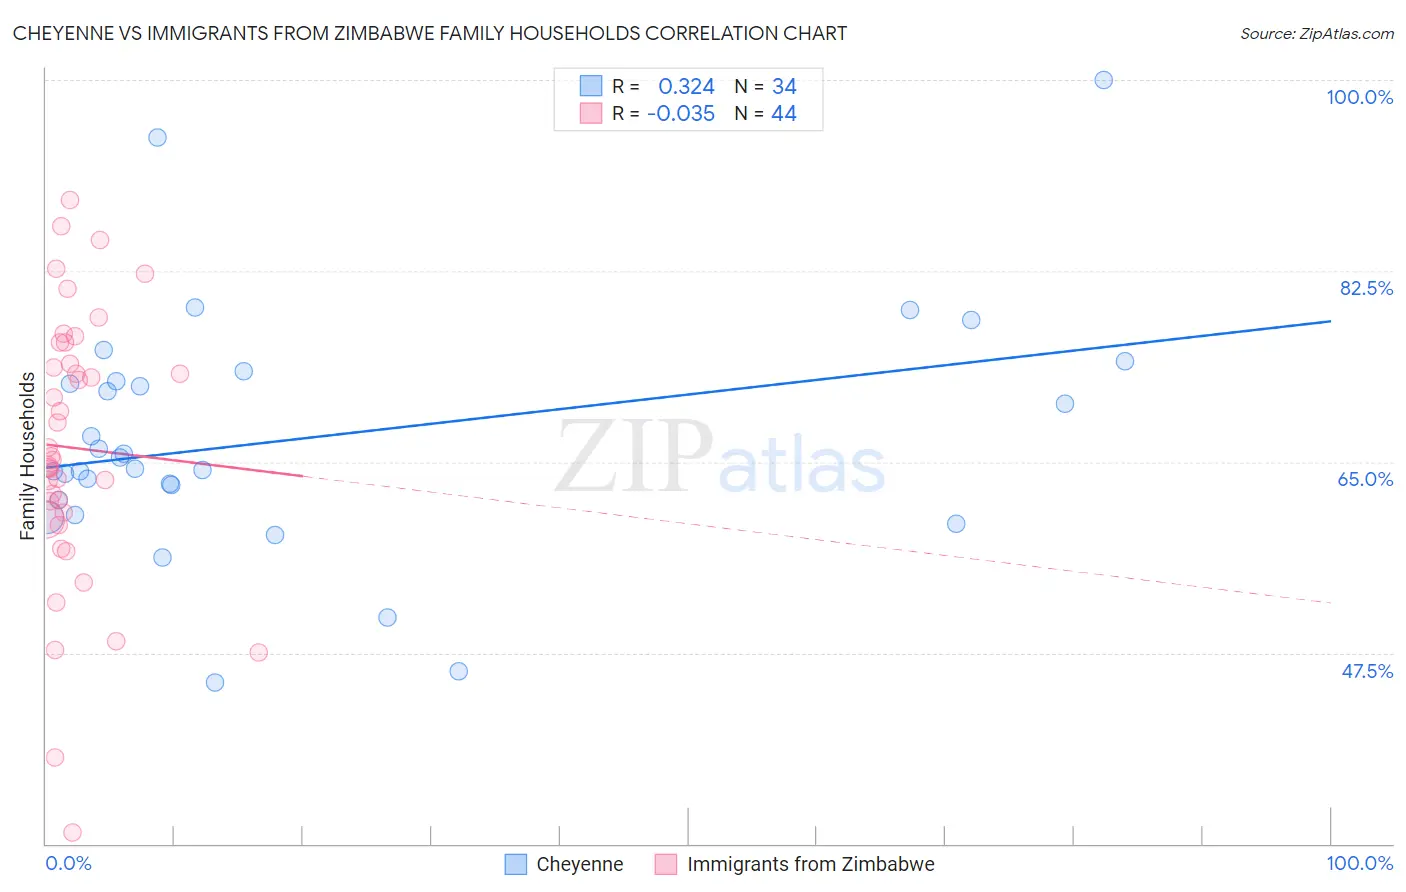
Cheyenne vs Immigrants from Zimbabwe Family Households Correlation Chart
The statistical analysis conducted on geographies consisting of 80,705,196 people shows a mild positive correlation between the proportion of Cheyenne and percentage of family households in the United States with a correlation coefficient (R) of 0.324 and weighted average of 63.2%. Similarly, the statistical analysis conducted on geographies consisting of 117,791,116 people shows no correlation between the proportion of Immigrants from Zimbabwe and percentage of family households in the United States with a correlation coefficient (R) of -0.035 and weighted average of 63.5%, a difference of 0.48%.
Family Households Correlation Summary
| Measurement | Cheyenne | Immigrants from Zimbabwe |
| Minimum | 44.8% | 31.0% |
| Maximum | 100.0% | 89.0% |
| Range | 55.2% | 57.9% |
| Mean | 67.2% | 66.3% |
| Median | 64.9% | 65.4% |
| Interquartile 25% (IQ1) | 61.5% | 60.0% |
| Interquartile 75% (IQ3) | 72.3% | 75.0% |
| Interquartile Range (IQR) | 10.9% | 15.0% |
| Standard Deviation (Sample) | 11.3% | 12.5% |
| Standard Deviation (Population) | 11.1% | 12.4% |
Similar Demographics by Family Households
Demographics Similar to Cheyenne by Family Households
In terms of family households, the demographic groups most similar to Cheyenne are Kenyan (63.2%, a difference of 0.010%), Immigrants from Ireland (63.2%, a difference of 0.020%), Colville (63.2%, a difference of 0.020%), Immigrants from Western Africa (63.1%, a difference of 0.020%), and Immigrants from Russia (63.2%, a difference of 0.030%).
| Demographics | Rating | Rank | Family Households |
| Luxembourgers | 0.9 /100 | #256 | Tragic 63.3% |
| Icelanders | 0.8 /100 | #257 | Tragic 63.3% |
| Immigrants | Barbados | 0.7 /100 | #258 | Tragic 63.2% |
| Immigrants | Western Europe | 0.6 /100 | #259 | Tragic 63.2% |
| Cypriots | 0.6 /100 | #260 | Tragic 63.2% |
| Immigrants | Russia | 0.6 /100 | #261 | Tragic 63.2% |
| Immigrants | Ireland | 0.6 /100 | #262 | Tragic 63.2% |
| Cheyenne | 0.5 /100 | #263 | Tragic 63.2% |
| Kenyans | 0.5 /100 | #264 | Tragic 63.2% |
| Colville | 0.5 /100 | #265 | Tragic 63.2% |
| Immigrants | Western Africa | 0.5 /100 | #266 | Tragic 63.1% |
| Israelis | 0.4 /100 | #267 | Tragic 63.1% |
| Immigrants | Singapore | 0.4 /100 | #268 | Tragic 63.1% |
| Yugoslavians | 0.4 /100 | #269 | Tragic 63.1% |
| Immigrants | Austria | 0.3 /100 | #270 | Tragic 63.1% |
Demographics Similar to Immigrants from Zimbabwe by Family Households
In terms of family households, the demographic groups most similar to Immigrants from Zimbabwe are Ghanaian (63.5%, a difference of 0.010%), Comanche (63.5%, a difference of 0.010%), Albanian (63.5%, a difference of 0.020%), Aleut (63.4%, a difference of 0.030%), and South African (63.4%, a difference of 0.030%).
| Demographics | Rating | Rank | Family Households |
| Immigrants | Greece | 2.9 /100 | #231 | Tragic 63.5% |
| Immigrants | Northern Africa | 2.6 /100 | #232 | Tragic 63.5% |
| Immigrants | Armenia | 2.6 /100 | #233 | Tragic 63.5% |
| Finns | 2.3 /100 | #234 | Tragic 63.5% |
| Albanians | 2.2 /100 | #235 | Tragic 63.5% |
| Ghanaians | 2.1 /100 | #236 | Tragic 63.5% |
| Comanche | 2.1 /100 | #237 | Tragic 63.5% |
| Immigrants | Zimbabwe | 2.0 /100 | #238 | Tragic 63.5% |
| Aleuts | 1.9 /100 | #239 | Tragic 63.4% |
| South Africans | 1.9 /100 | #240 | Tragic 63.4% |
| Immigrants | St. Vincent and the Grenadines | 1.9 /100 | #241 | Tragic 63.4% |
| Immigrants | Israel | 1.8 /100 | #242 | Tragic 63.4% |
| Immigrants | Czechoslovakia | 1.8 /100 | #243 | Tragic 63.4% |
| Eastern Europeans | 1.6 /100 | #244 | Tragic 63.4% |
| Immigrants | Dominica | 1.6 /100 | #245 | Tragic 63.4% |