Ecuadorian vs Polish Family Households
COMPARE
Ecuadorian
Polish
Family Households
Family Households Comparison
Ecuadorians
Poles
65.0%
FAMILY HOUSEHOLDS
95.4/ 100
METRIC RATING
115th/ 347
METRIC RANK
64.0%
FAMILY HOUSEHOLDS
18.9/ 100
METRIC RATING
198th/ 347
METRIC RANK
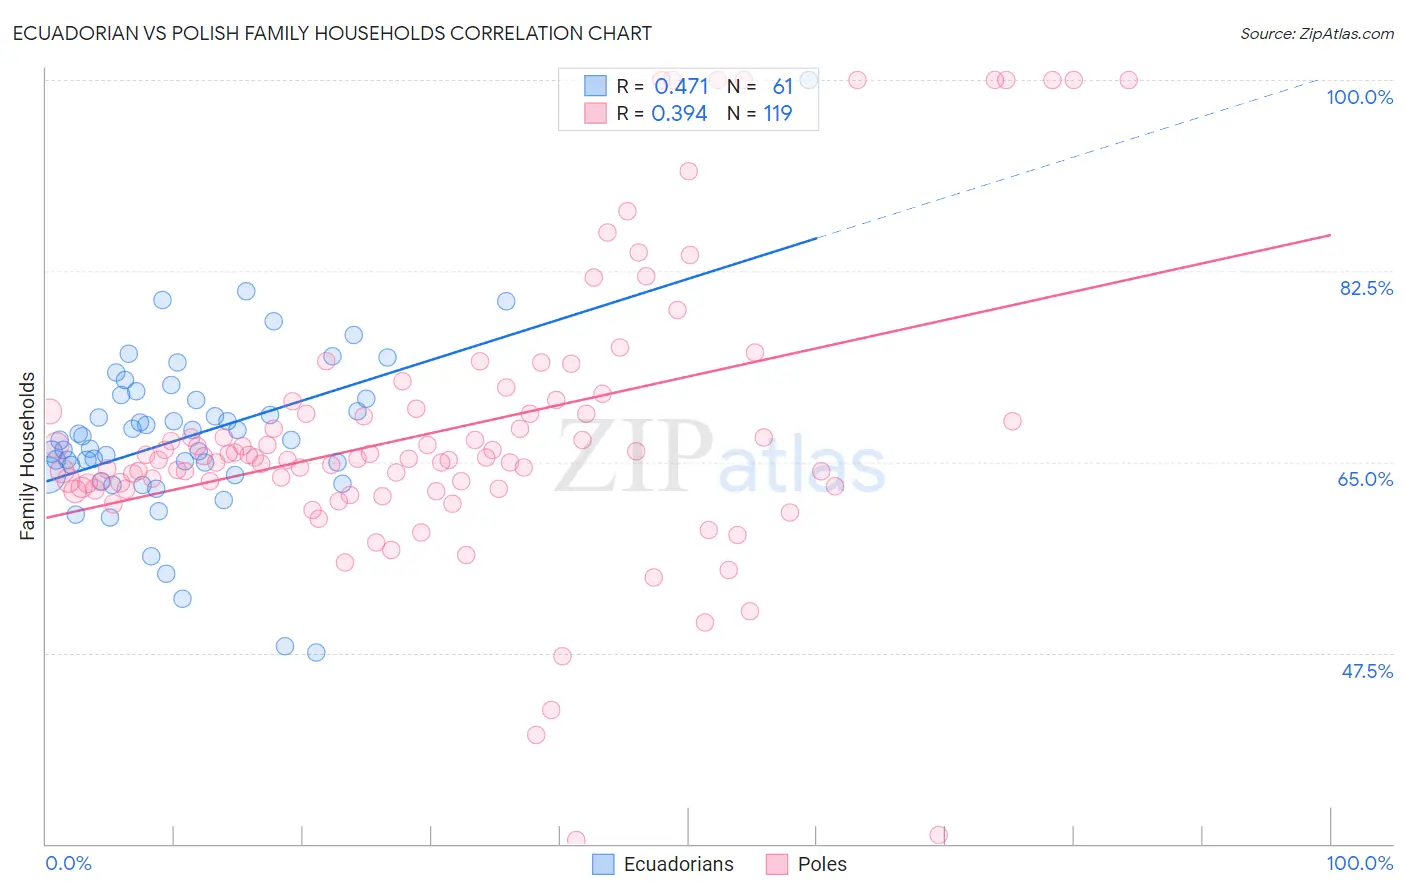
Ecuadorian vs Polish Family Households Correlation Chart
The statistical analysis conducted on geographies consisting of 317,646,947 people shows a moderate positive correlation between the proportion of Ecuadorians and percentage of family households in the United States with a correlation coefficient (R) of 0.471 and weighted average of 65.0%. Similarly, the statistical analysis conducted on geographies consisting of 559,976,877 people shows a mild positive correlation between the proportion of Poles and percentage of family households in the United States with a correlation coefficient (R) of 0.394 and weighted average of 64.0%, a difference of 1.5%.
Family Households Correlation Summary
| Measurement | Ecuadorian | Polish |
| Minimum | 47.6% | 30.3% |
| Maximum | 100.0% | 100.0% |
| Range | 52.4% | 69.7% |
| Mean | 67.4% | 68.0% |
| Median | 67.1% | 65.4% |
| Interquartile 25% (IQ1) | 63.8% | 62.7% |
| Interquartile 75% (IQ3) | 71.0% | 69.9% |
| Interquartile Range (IQR) | 7.2% | 7.2% |
| Standard Deviation (Sample) | 7.9% | 13.1% |
| Standard Deviation (Population) | 7.8% | 13.1% |
Similar Demographics by Family Households
Demographics Similar to Ecuadorians by Family Households
In terms of family households, the demographic groups most similar to Ecuadorians are Immigrants from Iraq (65.0%, a difference of 0.0%), Cherokee (65.0%, a difference of 0.010%), Dutch (64.9%, a difference of 0.020%), Argentinean (65.0%, a difference of 0.030%), and Spanish (65.0%, a difference of 0.060%).
| Demographics | Rating | Rank | Family Households |
| Palestinians | 97.2 /100 | #108 | Exceptional 65.1% |
| Immigrants | Guatemala | 96.9 /100 | #109 | Exceptional 65.0% |
| Scandinavians | 96.8 /100 | #110 | Exceptional 65.0% |
| Europeans | 96.8 /100 | #111 | Exceptional 65.0% |
| Immigrants | Jordan | 96.5 /100 | #112 | Exceptional 65.0% |
| Spanish | 96.2 /100 | #113 | Exceptional 65.0% |
| Argentineans | 95.7 /100 | #114 | Exceptional 65.0% |
| Ecuadorians | 95.4 /100 | #115 | Exceptional 65.0% |
| Immigrants | Iraq | 95.4 /100 | #116 | Exceptional 65.0% |
| Cherokee | 95.3 /100 | #117 | Exceptional 65.0% |
| Dutch | 95.1 /100 | #118 | Exceptional 64.9% |
| Immigrants | Eastern Asia | 94.4 /100 | #119 | Exceptional 64.9% |
| Immigrants | Oceania | 94.2 /100 | #120 | Exceptional 64.9% |
| Hungarians | 94.0 /100 | #121 | Exceptional 64.9% |
| Hmong | 93.4 /100 | #122 | Exceptional 64.9% |
Demographics Similar to Poles by Family Households
In terms of family households, the demographic groups most similar to Poles are Seminole (64.0%, a difference of 0.0%), Immigrants from Canada (64.0%, a difference of 0.010%), Slavic (64.0%, a difference of 0.010%), Immigrants from North America (64.0%, a difference of 0.020%), and Immigrants from Malaysia (64.0%, a difference of 0.020%).
| Demographics | Rating | Rank | Family Households |
| Arabs | 24.5 /100 | #191 | Fair 64.1% |
| Lithuanians | 23.8 /100 | #192 | Fair 64.0% |
| French | 23.7 /100 | #193 | Fair 64.0% |
| Paiute | 22.2 /100 | #194 | Fair 64.0% |
| Immigrants | North America | 20.0 /100 | #195 | Poor 64.0% |
| Immigrants | Canada | 19.2 /100 | #196 | Poor 64.0% |
| Seminole | 18.9 /100 | #197 | Poor 64.0% |
| Poles | 18.9 /100 | #198 | Poor 64.0% |
| Slavs | 18.6 /100 | #199 | Poor 64.0% |
| Immigrants | Malaysia | 17.9 /100 | #200 | Poor 64.0% |
| Immigrants | Eastern Europe | 17.2 /100 | #201 | Poor 64.0% |
| Iranians | 13.5 /100 | #202 | Poor 63.9% |
| Norwegians | 13.2 /100 | #203 | Poor 63.9% |
| Immigrants | Uruguay | 12.8 /100 | #204 | Poor 63.9% |
| Brazilians | 12.4 /100 | #205 | Poor 63.9% |