Ecuadorian vs Immigrants from Venezuela In Labor Force | Age 20-24
COMPARE
Ecuadorian
Immigrants from Venezuela
In Labor Force | Age 20-24
In Labor Force | Age 20-24 Comparison
Ecuadorians
Immigrants from Venezuela
72.4%
IN LABOR FORCE | AGE 20-24
0.0/ 100
METRIC RATING
303rd/ 347
METRIC RANK
73.2%
IN LABOR FORCE | AGE 20-24
0.1/ 100
METRIC RATING
281st/ 347
METRIC RANK
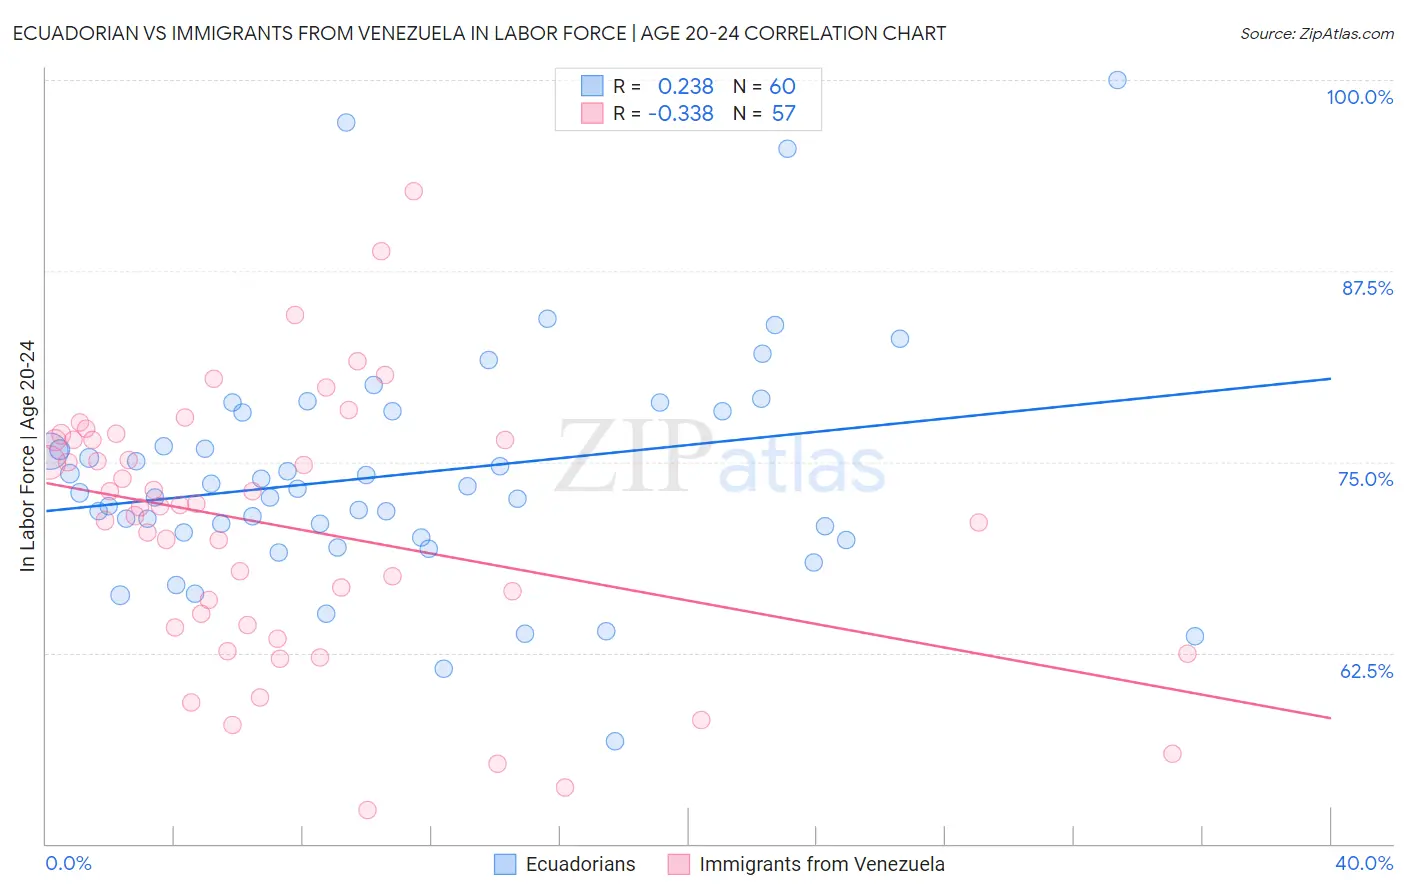
Ecuadorian vs Immigrants from Venezuela In Labor Force | Age 20-24 Correlation Chart
The statistical analysis conducted on geographies consisting of 317,809,827 people shows a weak positive correlation between the proportion of Ecuadorians and labor force participation rate among population between the ages 20 and 24 in the United States with a correlation coefficient (R) of 0.238 and weighted average of 72.4%. Similarly, the statistical analysis conducted on geographies consisting of 287,836,016 people shows a mild negative correlation between the proportion of Immigrants from Venezuela and labor force participation rate among population between the ages 20 and 24 in the United States with a correlation coefficient (R) of -0.338 and weighted average of 73.2%, a difference of 1.1%.
In Labor Force | Age 20-24 Correlation Summary
| Measurement | Ecuadorian | Immigrants from Venezuela |
| Minimum | 56.7% | 52.2% |
| Maximum | 100.0% | 92.7% |
| Range | 43.3% | 40.5% |
| Mean | 74.2% | 70.7% |
| Median | 73.1% | 72.1% |
| Interquartile 25% (IQ1) | 70.2% | 64.2% |
| Interquartile 75% (IQ3) | 78.2% | 76.5% |
| Interquartile Range (IQR) | 8.0% | 12.2% |
| Standard Deviation (Sample) | 7.7% | 8.6% |
| Standard Deviation (Population) | 7.7% | 8.5% |
Similar Demographics by In Labor Force | Age 20-24
Demographics Similar to Ecuadorians by In Labor Force | Age 20-24
In terms of in labor force | age 20-24, the demographic groups most similar to Ecuadorians are Native/Alaskan (72.4%, a difference of 0.010%), Immigrants from West Indies (72.4%, a difference of 0.010%), Immigrants from Singapore (72.4%, a difference of 0.040%), Immigrants from Jamaica (72.4%, a difference of 0.060%), and Cuban (72.5%, a difference of 0.10%).
| Demographics | Rating | Rank | In Labor Force | Age 20-24 |
| Jamaicans | 0.0 /100 | #296 | Tragic 72.7% |
| Central American Indians | 0.0 /100 | #297 | Tragic 72.7% |
| Israelis | 0.0 /100 | #298 | Tragic 72.6% |
| Iranians | 0.0 /100 | #299 | Tragic 72.6% |
| Armenians | 0.0 /100 | #300 | Tragic 72.5% |
| Cubans | 0.0 /100 | #301 | Tragic 72.5% |
| Natives/Alaskans | 0.0 /100 | #302 | Tragic 72.4% |
| Ecuadorians | 0.0 /100 | #303 | Tragic 72.4% |
| Immigrants | West Indies | 0.0 /100 | #304 | Tragic 72.4% |
| Immigrants | Singapore | 0.0 /100 | #305 | Tragic 72.4% |
| Immigrants | Jamaica | 0.0 /100 | #306 | Tragic 72.4% |
| Immigrants | Ecuador | 0.0 /100 | #307 | Tragic 72.3% |
| Soviet Union | 0.0 /100 | #308 | Tragic 72.3% |
| Tsimshian | 0.0 /100 | #309 | Tragic 72.3% |
| Immigrants | Cuba | 0.0 /100 | #310 | Tragic 72.0% |
Demographics Similar to Immigrants from Venezuela by In Labor Force | Age 20-24
In terms of in labor force | age 20-24, the demographic groups most similar to Immigrants from Venezuela are Immigrants from Spain (73.2%, a difference of 0.010%), Immigrants from Bahamas (73.2%, a difference of 0.010%), Bahamian (73.3%, a difference of 0.030%), Kiowa (73.2%, a difference of 0.040%), and Nicaraguan (73.2%, a difference of 0.090%).
| Demographics | Rating | Rank | In Labor Force | Age 20-24 |
| Immigrants | Colombia | 0.2 /100 | #274 | Tragic 73.4% |
| Immigrants | South America | 0.2 /100 | #275 | Tragic 73.3% |
| Mongolians | 0.2 /100 | #276 | Tragic 73.3% |
| Immigrants | Malaysia | 0.2 /100 | #277 | Tragic 73.3% |
| Cypriots | 0.2 /100 | #278 | Tragic 73.3% |
| Venezuelans | 0.2 /100 | #279 | Tragic 73.3% |
| Bahamians | 0.1 /100 | #280 | Tragic 73.3% |
| Immigrants | Venezuela | 0.1 /100 | #281 | Tragic 73.2% |
| Immigrants | Spain | 0.1 /100 | #282 | Tragic 73.2% |
| Immigrants | Bahamas | 0.1 /100 | #283 | Tragic 73.2% |
| Kiowa | 0.1 /100 | #284 | Tragic 73.2% |
| Nicaraguans | 0.1 /100 | #285 | Tragic 73.2% |
| Immigrants | Lebanon | 0.1 /100 | #286 | Tragic 73.1% |
| Immigrants | Korea | 0.1 /100 | #287 | Tragic 73.1% |
| Argentineans | 0.1 /100 | #288 | Tragic 73.1% |