Ecuadorian vs Panamanian Currently Married
COMPARE
Ecuadorian
Panamanian
Currently Married
Currently Married Comparison
Ecuadorians
Panamanians
43.6%
CURRENTLY MARRIED
0.1/ 100
METRIC RATING
266th/ 347
METRIC RANK
45.3%
CURRENTLY MARRIED
4.0/ 100
METRIC RATING
218th/ 347
METRIC RANK
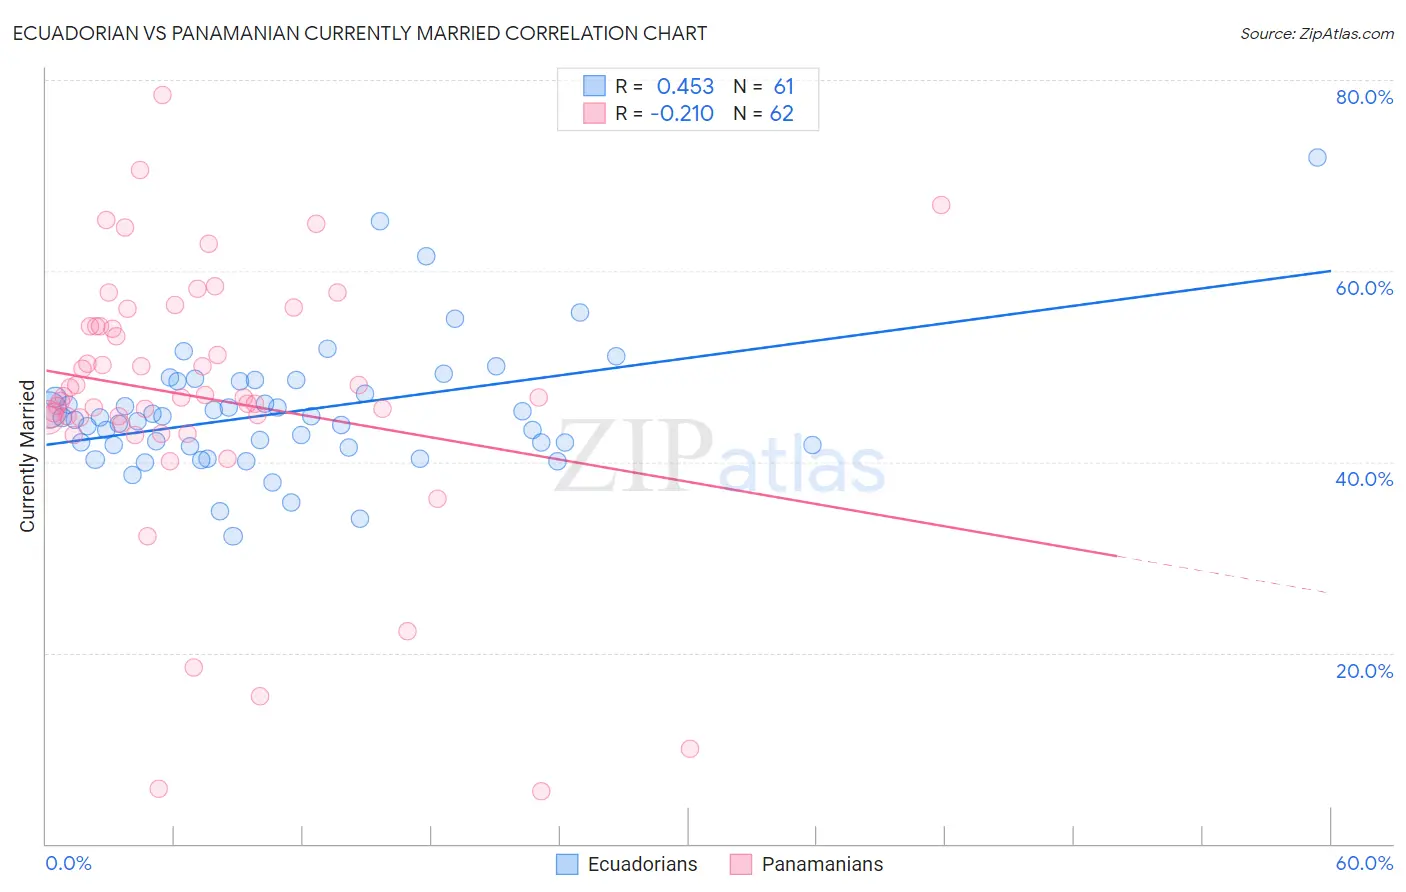
Ecuadorian vs Panamanian Currently Married Correlation Chart
The statistical analysis conducted on geographies consisting of 317,807,476 people shows a moderate positive correlation between the proportion of Ecuadorians and percentage of population currently married in the United States with a correlation coefficient (R) of 0.453 and weighted average of 43.6%. Similarly, the statistical analysis conducted on geographies consisting of 281,208,339 people shows a weak negative correlation between the proportion of Panamanians and percentage of population currently married in the United States with a correlation coefficient (R) of -0.210 and weighted average of 45.3%, a difference of 3.8%.
Currently Married Correlation Summary
| Measurement | Ecuadorian | Panamanian |
| Minimum | 32.2% | 5.5% |
| Maximum | 71.9% | 78.4% |
| Range | 39.7% | 72.9% |
| Mean | 45.2% | 46.8% |
| Median | 44.6% | 46.8% |
| Interquartile 25% (IQ1) | 41.7% | 44.6% |
| Interquartile 75% (IQ3) | 48.4% | 54.2% |
| Interquartile Range (IQR) | 6.8% | 9.5% |
| Standard Deviation (Sample) | 6.7% | 14.0% |
| Standard Deviation (Population) | 6.7% | 13.9% |
Similar Demographics by Currently Married
Demographics Similar to Ecuadorians by Currently Married
In terms of currently married, the demographic groups most similar to Ecuadorians are Immigrants from Eritrea (43.6%, a difference of 0.030%), Spanish American Indian (43.6%, a difference of 0.030%), Immigrants from Bangladesh (43.6%, a difference of 0.070%), Sudanese (43.7%, a difference of 0.15%), and Immigrants from Cuba (43.7%, a difference of 0.16%).
| Demographics | Rating | Rank | Currently Married |
| Immigrants | Sierra Leone | 0.1 /100 | #259 | Tragic 43.8% |
| Immigrants | Latin America | 0.1 /100 | #260 | Tragic 43.8% |
| Immigrants | Nicaragua | 0.1 /100 | #261 | Tragic 43.7% |
| Bangladeshis | 0.1 /100 | #262 | Tragic 43.7% |
| Immigrants | Cuba | 0.1 /100 | #263 | Tragic 43.7% |
| Sudanese | 0.1 /100 | #264 | Tragic 43.7% |
| Immigrants | Bangladesh | 0.1 /100 | #265 | Tragic 43.6% |
| Ecuadorians | 0.1 /100 | #266 | Tragic 43.6% |
| Immigrants | Eritrea | 0.1 /100 | #267 | Tragic 43.6% |
| Spanish American Indians | 0.1 /100 | #268 | Tragic 43.6% |
| Immigrants | Sudan | 0.1 /100 | #269 | Tragic 43.5% |
| Salvadorans | 0.1 /100 | #270 | Tragic 43.5% |
| Bermudans | 0.1 /100 | #271 | Tragic 43.5% |
| Indonesians | 0.1 /100 | #272 | Tragic 43.5% |
| Yaqui | 0.1 /100 | #273 | Tragic 43.4% |
Demographics Similar to Panamanians by Currently Married
In terms of currently married, the demographic groups most similar to Panamanians are Immigrants from Portugal (45.2%, a difference of 0.12%), Immigrants from Thailand (45.4%, a difference of 0.24%), Kenyan (45.2%, a difference of 0.24%), Mexican (45.2%, a difference of 0.26%), and Immigrants from Morocco (45.4%, a difference of 0.33%).
| Demographics | Rating | Rank | Currently Married |
| Houma | 7.2 /100 | #211 | Tragic 45.5% |
| Marshallese | 7.2 /100 | #212 | Tragic 45.5% |
| Alaska Natives | 7.0 /100 | #213 | Tragic 45.5% |
| Dutch West Indians | 6.7 /100 | #214 | Tragic 45.5% |
| German Russians | 6.7 /100 | #215 | Tragic 45.5% |
| Immigrants | Morocco | 5.5 /100 | #216 | Tragic 45.4% |
| Immigrants | Thailand | 5.1 /100 | #217 | Tragic 45.4% |
| Panamanians | 4.0 /100 | #218 | Tragic 45.3% |
| Immigrants | Portugal | 3.5 /100 | #219 | Tragic 45.2% |
| Kenyans | 3.1 /100 | #220 | Tragic 45.2% |
| Mexicans | 3.0 /100 | #221 | Tragic 45.2% |
| Immigrants | Azores | 2.5 /100 | #222 | Tragic 45.1% |
| Immigrants | Laos | 2.3 /100 | #223 | Tragic 45.0% |
| Immigrants | Uganda | 2.2 /100 | #224 | Tragic 45.0% |
| French American Indians | 2.2 /100 | #225 | Tragic 45.0% |