Ecuadorian vs French Canadian Currently Married
COMPARE
Ecuadorian
French Canadian
Currently Married
Currently Married Comparison
Ecuadorians
French Canadians
43.6%
CURRENTLY MARRIED
0.1/ 100
METRIC RATING
266th/ 347
METRIC RANK
48.0%
CURRENTLY MARRIED
96.3/ 100
METRIC RATING
85th/ 347
METRIC RANK
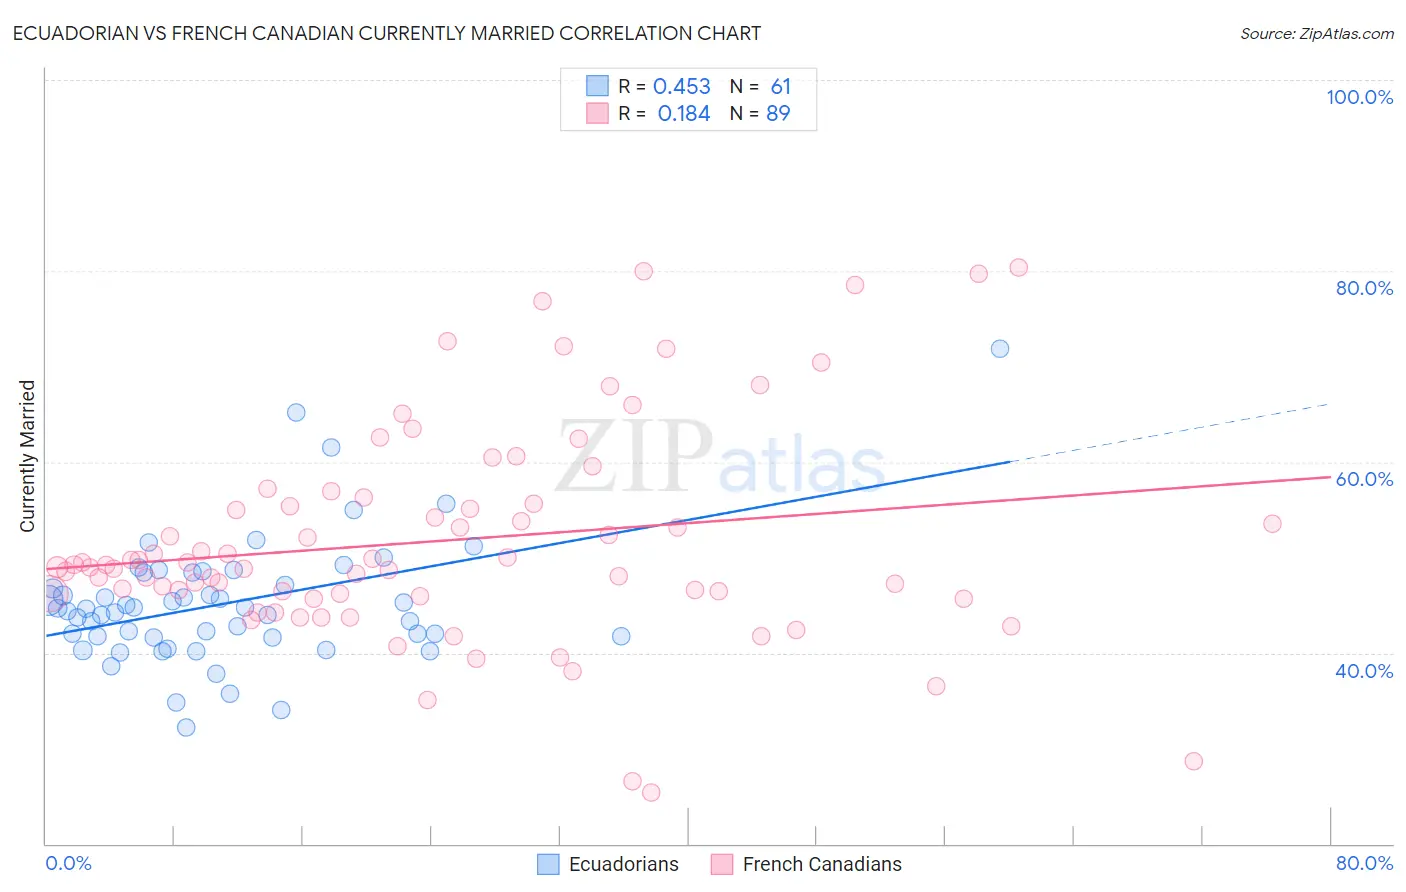
Ecuadorian vs French Canadian Currently Married Correlation Chart
The statistical analysis conducted on geographies consisting of 317,807,476 people shows a moderate positive correlation between the proportion of Ecuadorians and percentage of population currently married in the United States with a correlation coefficient (R) of 0.453 and weighted average of 43.6%. Similarly, the statistical analysis conducted on geographies consisting of 502,604,135 people shows a poor positive correlation between the proportion of French Canadians and percentage of population currently married in the United States with a correlation coefficient (R) of 0.184 and weighted average of 48.0%, a difference of 10.2%.
Currently Married Correlation Summary
| Measurement | Ecuadorian | French Canadian |
| Minimum | 32.2% | 25.4% |
| Maximum | 71.9% | 80.4% |
| Range | 39.7% | 55.0% |
| Mean | 45.2% | 51.8% |
| Median | 44.6% | 49.2% |
| Interquartile 25% (IQ1) | 41.7% | 46.0% |
| Interquartile 75% (IQ3) | 48.4% | 55.9% |
| Interquartile Range (IQR) | 6.8% | 9.9% |
| Standard Deviation (Sample) | 6.7% | 11.3% |
| Standard Deviation (Population) | 6.7% | 11.3% |
Similar Demographics by Currently Married
Demographics Similar to Ecuadorians by Currently Married
In terms of currently married, the demographic groups most similar to Ecuadorians are Immigrants from Eritrea (43.6%, a difference of 0.030%), Spanish American Indian (43.6%, a difference of 0.030%), Immigrants from Bangladesh (43.6%, a difference of 0.070%), Sudanese (43.7%, a difference of 0.15%), and Immigrants from Cuba (43.7%, a difference of 0.16%).
| Demographics | Rating | Rank | Currently Married |
| Immigrants | Sierra Leone | 0.1 /100 | #259 | Tragic 43.8% |
| Immigrants | Latin America | 0.1 /100 | #260 | Tragic 43.8% |
| Immigrants | Nicaragua | 0.1 /100 | #261 | Tragic 43.7% |
| Bangladeshis | 0.1 /100 | #262 | Tragic 43.7% |
| Immigrants | Cuba | 0.1 /100 | #263 | Tragic 43.7% |
| Sudanese | 0.1 /100 | #264 | Tragic 43.7% |
| Immigrants | Bangladesh | 0.1 /100 | #265 | Tragic 43.6% |
| Ecuadorians | 0.1 /100 | #266 | Tragic 43.6% |
| Immigrants | Eritrea | 0.1 /100 | #267 | Tragic 43.6% |
| Spanish American Indians | 0.1 /100 | #268 | Tragic 43.6% |
| Immigrants | Sudan | 0.1 /100 | #269 | Tragic 43.5% |
| Salvadorans | 0.1 /100 | #270 | Tragic 43.5% |
| Bermudans | 0.1 /100 | #271 | Tragic 43.5% |
| Indonesians | 0.1 /100 | #272 | Tragic 43.5% |
| Yaqui | 0.1 /100 | #273 | Tragic 43.4% |
Demographics Similar to French Canadians by Currently Married
In terms of currently married, the demographic groups most similar to French Canadians are Immigrants from Japan (48.0%, a difference of 0.030%), Jordanian (48.0%, a difference of 0.040%), Immigrants from Eastern Europe (48.0%, a difference of 0.060%), Indian (Asian) (48.0%, a difference of 0.12%), and Bolivian (48.1%, a difference of 0.14%).
| Demographics | Rating | Rank | Currently Married |
| Immigrants | Belgium | 97.1 /100 | #78 | Exceptional 48.1% |
| Immigrants | South Africa | 97.0 /100 | #79 | Exceptional 48.1% |
| Immigrants | Poland | 96.9 /100 | #80 | Exceptional 48.1% |
| Immigrants | Sri Lanka | 96.9 /100 | #81 | Exceptional 48.1% |
| Immigrants | Europe | 96.9 /100 | #82 | Exceptional 48.1% |
| Bolivians | 96.9 /100 | #83 | Exceptional 48.1% |
| Immigrants | Israel | 96.9 /100 | #84 | Exceptional 48.1% |
| French Canadians | 96.3 /100 | #85 | Exceptional 48.0% |
| Immigrants | Japan | 96.2 /100 | #86 | Exceptional 48.0% |
| Jordanians | 96.2 /100 | #87 | Exceptional 48.0% |
| Immigrants | Eastern Europe | 96.1 /100 | #88 | Exceptional 48.0% |
| Indians (Asian) | 95.8 /100 | #89 | Exceptional 48.0% |
| Americans | 95.7 /100 | #90 | Exceptional 48.0% |
| Immigrants | Bolivia | 95.6 /100 | #91 | Exceptional 47.9% |
| Koreans | 95.4 /100 | #92 | Exceptional 47.9% |