Ecuadorian vs Scandinavian Currently Married
COMPARE
Ecuadorian
Scandinavian
Currently Married
Currently Married Comparison
Ecuadorians
Scandinavians
43.6%
CURRENTLY MARRIED
0.1/ 100
METRIC RATING
266th/ 347
METRIC RANK
49.5%
CURRENTLY MARRIED
99.9/ 100
METRIC RATING
17th/ 347
METRIC RANK
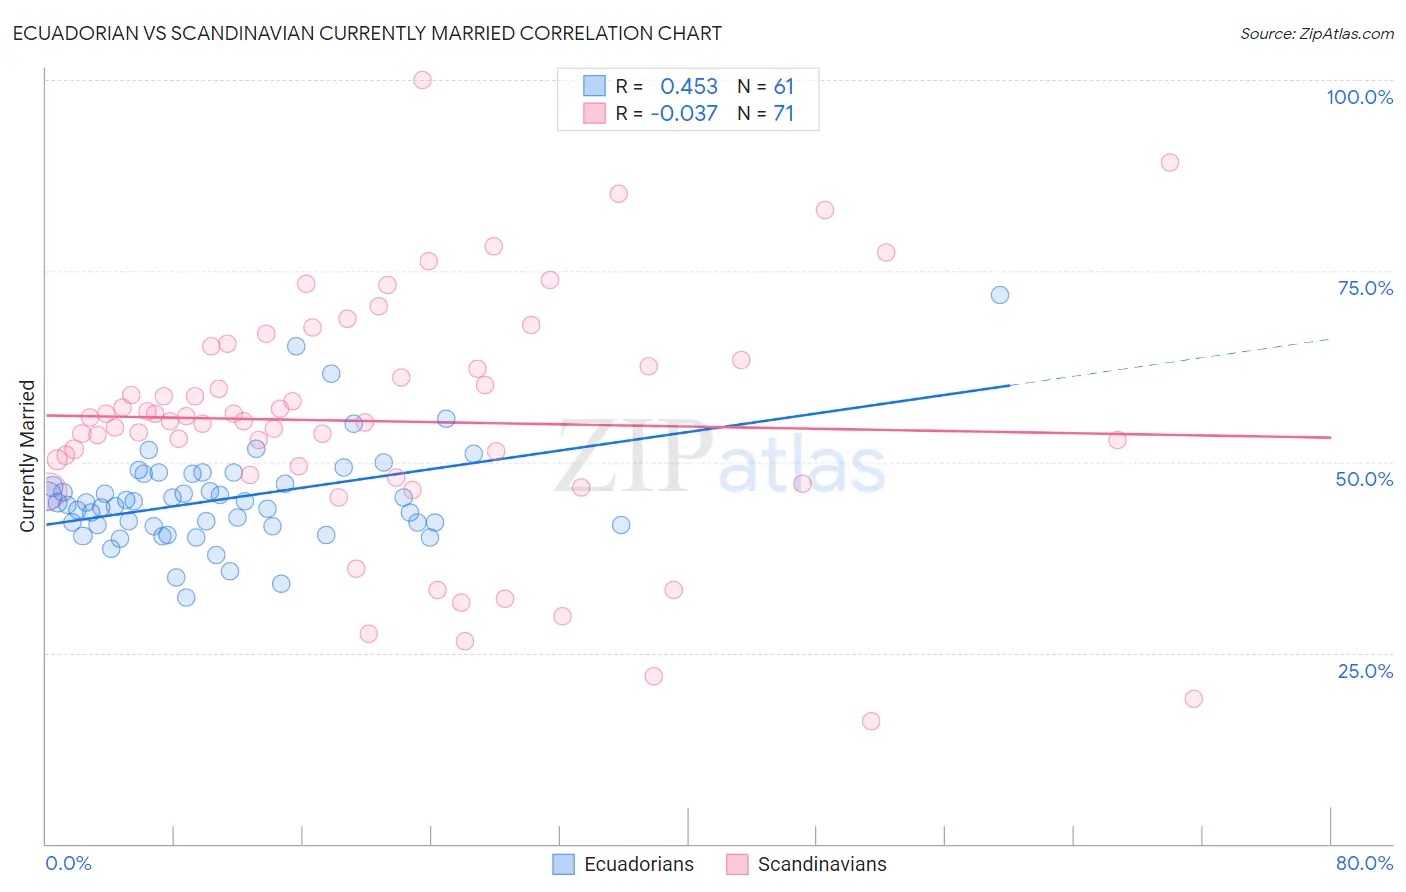
Ecuadorian vs Scandinavian Currently Married Correlation Chart
The statistical analysis conducted on geographies consisting of 317,807,476 people shows a moderate positive correlation between the proportion of Ecuadorians and percentage of population currently married in the United States with a correlation coefficient (R) of 0.453 and weighted average of 43.6%. Similarly, the statistical analysis conducted on geographies consisting of 472,583,978 people shows no correlation between the proportion of Scandinavians and percentage of population currently married in the United States with a correlation coefficient (R) of -0.037 and weighted average of 49.5%, a difference of 13.5%.
Currently Married Correlation Summary
| Measurement | Ecuadorian | Scandinavian |
| Minimum | 32.2% | 16.0% |
| Maximum | 71.9% | 100.0% |
| Range | 39.7% | 84.0% |
| Mean | 45.2% | 55.3% |
| Median | 44.6% | 55.3% |
| Interquartile 25% (IQ1) | 41.7% | 48.3% |
| Interquartile 75% (IQ3) | 48.4% | 63.3% |
| Interquartile Range (IQR) | 6.8% | 15.0% |
| Standard Deviation (Sample) | 6.7% | 16.0% |
| Standard Deviation (Population) | 6.7% | 15.9% |
Similar Demographics by Currently Married
Demographics Similar to Ecuadorians by Currently Married
In terms of currently married, the demographic groups most similar to Ecuadorians are Immigrants from Eritrea (43.6%, a difference of 0.030%), Spanish American Indian (43.6%, a difference of 0.030%), Immigrants from Bangladesh (43.6%, a difference of 0.070%), Sudanese (43.7%, a difference of 0.15%), and Immigrants from Cuba (43.7%, a difference of 0.16%).
| Demographics | Rating | Rank | Currently Married |
| Immigrants | Sierra Leone | 0.1 /100 | #259 | Tragic 43.8% |
| Immigrants | Latin America | 0.1 /100 | #260 | Tragic 43.8% |
| Immigrants | Nicaragua | 0.1 /100 | #261 | Tragic 43.7% |
| Bangladeshis | 0.1 /100 | #262 | Tragic 43.7% |
| Immigrants | Cuba | 0.1 /100 | #263 | Tragic 43.7% |
| Sudanese | 0.1 /100 | #264 | Tragic 43.7% |
| Immigrants | Bangladesh | 0.1 /100 | #265 | Tragic 43.6% |
| Ecuadorians | 0.1 /100 | #266 | Tragic 43.6% |
| Immigrants | Eritrea | 0.1 /100 | #267 | Tragic 43.6% |
| Spanish American Indians | 0.1 /100 | #268 | Tragic 43.6% |
| Immigrants | Sudan | 0.1 /100 | #269 | Tragic 43.5% |
| Salvadorans | 0.1 /100 | #270 | Tragic 43.5% |
| Bermudans | 0.1 /100 | #271 | Tragic 43.5% |
| Indonesians | 0.1 /100 | #272 | Tragic 43.5% |
| Yaqui | 0.1 /100 | #273 | Tragic 43.4% |
Demographics Similar to Scandinavians by Currently Married
In terms of currently married, the demographic groups most similar to Scandinavians are Chinese (49.5%, a difference of 0.020%), Pennsylvania German (49.6%, a difference of 0.16%), German (49.6%, a difference of 0.19%), Dutch (49.6%, a difference of 0.20%), and Immigrants from Scotland (49.3%, a difference of 0.29%).
| Demographics | Rating | Rank | Currently Married |
| Filipinos | 99.9 /100 | #10 | Exceptional 49.7% |
| English | 99.9 /100 | #11 | Exceptional 49.7% |
| Swiss | 99.9 /100 | #12 | Exceptional 49.7% |
| Dutch | 99.9 /100 | #13 | Exceptional 49.6% |
| Germans | 99.9 /100 | #14 | Exceptional 49.6% |
| Pennsylvania Germans | 99.9 /100 | #15 | Exceptional 49.6% |
| Chinese | 99.9 /100 | #16 | Exceptional 49.5% |
| Scandinavians | 99.9 /100 | #17 | Exceptional 49.5% |
| Immigrants | Scotland | 99.8 /100 | #18 | Exceptional 49.3% |
| Europeans | 99.8 /100 | #19 | Exceptional 49.3% |
| Luxembourgers | 99.8 /100 | #20 | Exceptional 49.3% |
| Scottish | 99.8 /100 | #21 | Exceptional 49.2% |
| Bulgarians | 99.7 /100 | #22 | Exceptional 49.1% |
| Immigrants | Pakistan | 99.7 /100 | #23 | Exceptional 49.1% |
| Lithuanians | 99.6 /100 | #24 | Exceptional 49.0% |