Ecuadorian vs Immigrants from Venezuela Kindergarten
COMPARE
Ecuadorian
Immigrants from Venezuela
Kindergarten
Kindergarten Comparison
Ecuadorians
Immigrants from Venezuela
97.0%
KINDERGARTEN
0.0/ 100
METRIC RATING
305th/ 347
METRIC RANK
97.9%
KINDERGARTEN
47.9/ 100
METRIC RATING
177th/ 347
METRIC RANK
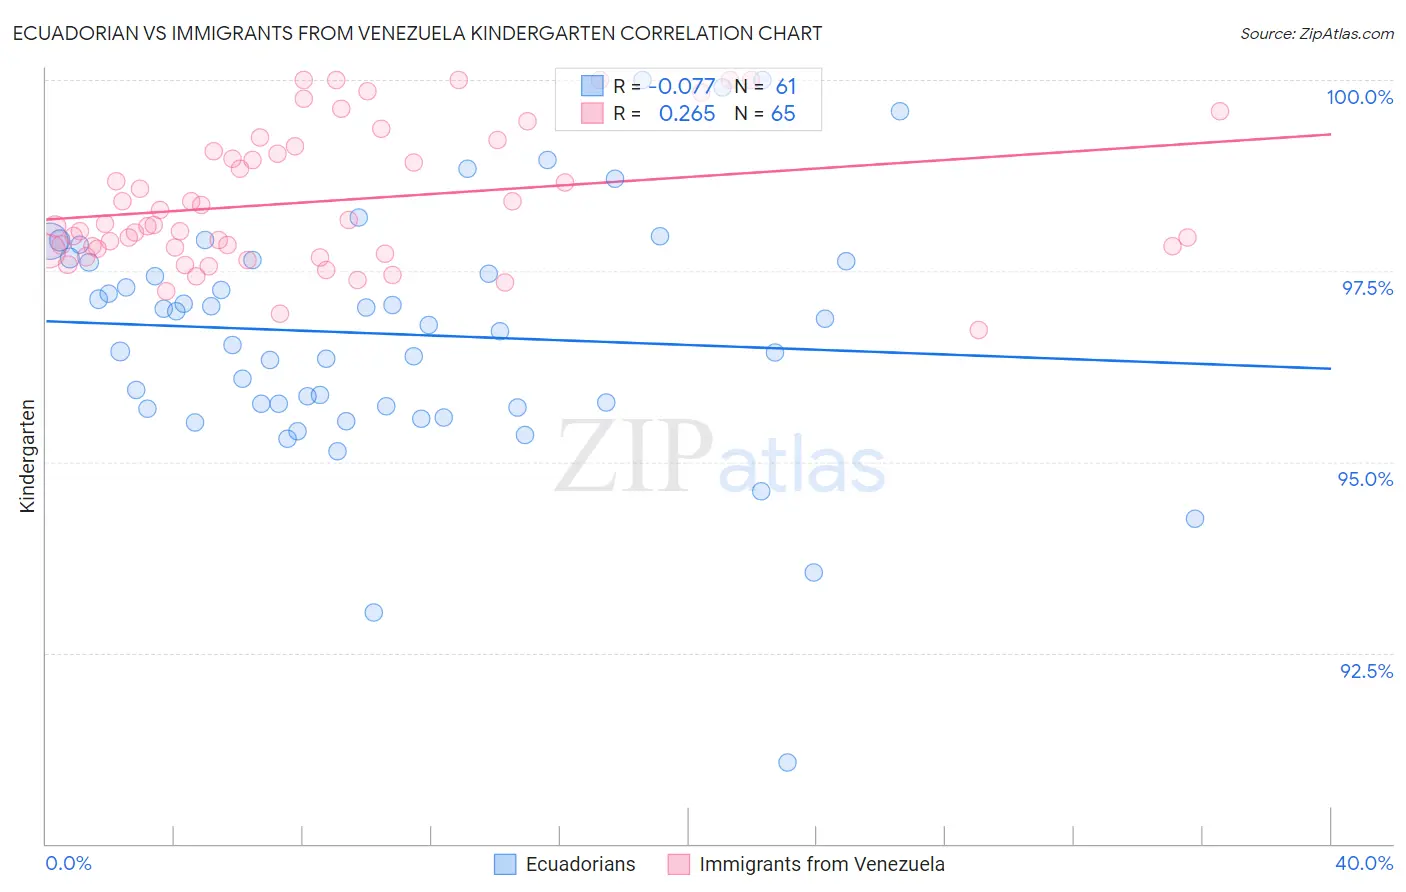
Ecuadorian vs Immigrants from Venezuela Kindergarten Correlation Chart
The statistical analysis conducted on geographies consisting of 317,865,723 people shows a slight negative correlation between the proportion of Ecuadorians and percentage of population with at least kindergarten education in the United States with a correlation coefficient (R) of -0.077 and weighted average of 97.0%. Similarly, the statistical analysis conducted on geographies consisting of 287,866,009 people shows a weak positive correlation between the proportion of Immigrants from Venezuela and percentage of population with at least kindergarten education in the United States with a correlation coefficient (R) of 0.265 and weighted average of 97.9%, a difference of 0.94%.
Kindergarten Correlation Summary
| Measurement | Ecuadorian | Immigrants from Venezuela |
| Minimum | 91.1% | 96.7% |
| Maximum | 100.0% | 100.0% |
| Range | 8.9% | 3.3% |
| Mean | 96.7% | 98.4% |
| Median | 96.8% | 98.1% |
| Interquartile 25% (IQ1) | 95.7% | 97.8% |
| Interquartile 75% (IQ3) | 97.6% | 99.1% |
| Interquartile Range (IQR) | 1.9% | 1.3% |
| Standard Deviation (Sample) | 1.6% | 0.88% |
| Standard Deviation (Population) | 1.6% | 0.88% |
Similar Demographics by Kindergarten
Demographics Similar to Ecuadorians by Kindergarten
In terms of kindergarten, the demographic groups most similar to Ecuadorians are Nicaraguan (97.0%, a difference of 0.0%), Somali (97.0%, a difference of 0.010%), Immigrants from Caribbean (97.1%, a difference of 0.040%), Belizean (97.0%, a difference of 0.050%), and Hispanic or Latino (97.0%, a difference of 0.060%).
| Demographics | Rating | Rank | Kindergarten |
| Immigrants | Dominica | 0.0 /100 | #298 | Tragic 97.1% |
| Immigrants | Cuba | 0.0 /100 | #299 | Tragic 97.1% |
| Haitians | 0.0 /100 | #300 | Tragic 97.1% |
| Immigrants | South Eastern Asia | 0.0 /100 | #301 | Tragic 97.1% |
| Immigrants | Caribbean | 0.0 /100 | #302 | Tragic 97.1% |
| Somalis | 0.0 /100 | #303 | Tragic 97.0% |
| Nicaraguans | 0.0 /100 | #304 | Tragic 97.0% |
| Ecuadorians | 0.0 /100 | #305 | Tragic 97.0% |
| Belizeans | 0.0 /100 | #306 | Tragic 97.0% |
| Hispanics or Latinos | 0.0 /100 | #307 | Tragic 97.0% |
| Immigrants | Somalia | 0.0 /100 | #308 | Tragic 97.0% |
| Immigrants | Haiti | 0.0 /100 | #309 | Tragic 97.0% |
| Immigrants | Azores | 0.0 /100 | #310 | Tragic 97.0% |
| Sri Lankans | 0.0 /100 | #311 | Tragic 97.0% |
| Guyanese | 0.0 /100 | #312 | Tragic 96.9% |
Demographics Similar to Immigrants from Venezuela by Kindergarten
In terms of kindergarten, the demographic groups most similar to Immigrants from Venezuela are Albanian (97.9%, a difference of 0.0%), Brazilian (97.9%, a difference of 0.0%), Argentinean (97.9%, a difference of 0.0%), Immigrants from Bosnia and Herzegovina (97.9%, a difference of 0.0%), and Native/Alaskan (98.0%, a difference of 0.010%).
| Demographics | Rating | Rank | Kindergarten |
| Bermudans | 54.0 /100 | #170 | Average 98.0% |
| Immigrants | Jordan | 54.0 /100 | #171 | Average 98.0% |
| Natives/Alaskans | 51.0 /100 | #172 | Average 98.0% |
| Kenyans | 51.0 /100 | #173 | Average 98.0% |
| Immigrants | Brazil | 50.0 /100 | #174 | Average 98.0% |
| Immigrants | Sri Lanka | 49.6 /100 | #175 | Average 97.9% |
| Albanians | 48.5 /100 | #176 | Average 97.9% |
| Immigrants | Venezuela | 47.9 /100 | #177 | Average 97.9% |
| Brazilians | 47.6 /100 | #178 | Average 97.9% |
| Argentineans | 46.8 /100 | #179 | Average 97.9% |
| Immigrants | Bosnia and Herzegovina | 46.7 /100 | #180 | Average 97.9% |
| Portuguese | 43.5 /100 | #181 | Average 97.9% |
| Egyptians | 42.4 /100 | #182 | Average 97.9% |
| Immigrants | Poland | 41.4 /100 | #183 | Average 97.9% |
| Immigrants | Argentina | 40.7 /100 | #184 | Average 97.9% |