Ecuadorian vs Barbadian Single Mother Households
COMPARE
Ecuadorian
Barbadian
Single Mother Households
Single Mother Households Comparison
Ecuadorians
Barbadians
7.2%
SINGLE MOTHER HOUSEHOLDS
0.6/ 100
METRIC RATING
243rd/ 347
METRIC RANK
7.9%
SINGLE MOTHER HOUSEHOLDS
0.0/ 100
METRIC RATING
295th/ 347
METRIC RANK
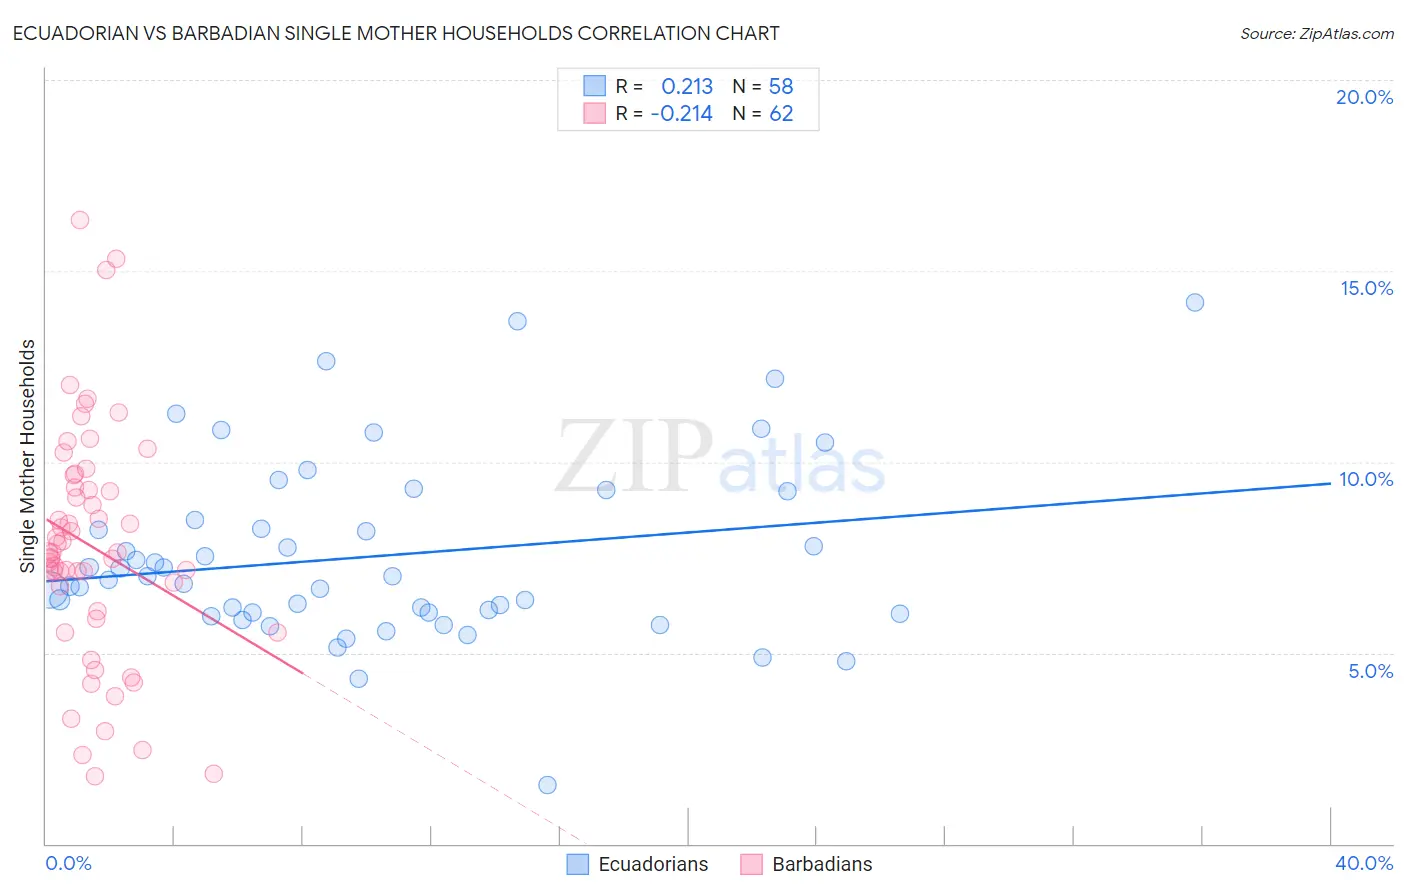
Ecuadorian vs Barbadian Single Mother Households Correlation Chart
The statistical analysis conducted on geographies consisting of 317,272,224 people shows a weak positive correlation between the proportion of Ecuadorians and percentage of single mother households in the United States with a correlation coefficient (R) of 0.213 and weighted average of 7.2%. Similarly, the statistical analysis conducted on geographies consisting of 141,217,581 people shows a weak negative correlation between the proportion of Barbadians and percentage of single mother households in the United States with a correlation coefficient (R) of -0.214 and weighted average of 7.9%, a difference of 9.8%.
Single Mother Households Correlation Summary
| Measurement | Ecuadorian | Barbadian |
| Minimum | 1.5% | 1.8% |
| Maximum | 14.2% | 16.3% |
| Range | 12.7% | 14.6% |
| Mean | 7.5% | 7.8% |
| Median | 7.0% | 7.6% |
| Interquartile 25% (IQ1) | 6.0% | 6.1% |
| Interquartile 75% (IQ3) | 8.5% | 9.3% |
| Interquartile Range (IQR) | 2.5% | 3.2% |
| Standard Deviation (Sample) | 2.4% | 3.1% |
| Standard Deviation (Population) | 2.4% | 3.0% |
Similar Demographics by Single Mother Households
Demographics Similar to Ecuadorians by Single Mother Households
In terms of single mother households, the demographic groups most similar to Ecuadorians are Fijian (7.2%, a difference of 0.050%), Cuban (7.2%, a difference of 0.070%), Immigrants from Portugal (7.2%, a difference of 0.13%), Immigrants from Cambodia (7.2%, a difference of 0.41%), and Immigrants from Panama (7.2%, a difference of 0.48%).
| Demographics | Rating | Rank | Single Mother Households |
| Ute | 1.0 /100 | #236 | Tragic 7.1% |
| Arapaho | 1.0 /100 | #237 | Tragic 7.1% |
| Panamanians | 0.9 /100 | #238 | Tragic 7.1% |
| Kiowa | 0.8 /100 | #239 | Tragic 7.1% |
| Immigrants | Panama | 0.7 /100 | #240 | Tragic 7.2% |
| Immigrants | Portugal | 0.6 /100 | #241 | Tragic 7.2% |
| Fijians | 0.6 /100 | #242 | Tragic 7.2% |
| Ecuadorians | 0.6 /100 | #243 | Tragic 7.2% |
| Cubans | 0.6 /100 | #244 | Tragic 7.2% |
| Immigrants | Cambodia | 0.5 /100 | #245 | Tragic 7.2% |
| Nicaraguans | 0.5 /100 | #246 | Tragic 7.2% |
| Dutch West Indians | 0.4 /100 | #247 | Tragic 7.3% |
| Spanish American Indians | 0.4 /100 | #248 | Tragic 7.3% |
| Bermudans | 0.4 /100 | #249 | Tragic 7.3% |
| Immigrants | Africa | 0.4 /100 | #250 | Tragic 7.3% |
Demographics Similar to Barbadians by Single Mother Households
In terms of single mother households, the demographic groups most similar to Barbadians are Immigrants from Latin America (7.9%, a difference of 0.060%), Hispanic or Latino (7.9%, a difference of 0.10%), Immigrants from West Indies (7.9%, a difference of 0.22%), Apache (7.9%, a difference of 0.29%), and Houma (7.9%, a difference of 0.30%).
| Demographics | Rating | Rank | Single Mother Households |
| Sierra Leoneans | 0.0 /100 | #288 | Tragic 7.7% |
| Sub-Saharan Africans | 0.0 /100 | #289 | Tragic 7.8% |
| Immigrants | Nigeria | 0.0 /100 | #290 | Tragic 7.8% |
| West Indians | 0.0 /100 | #291 | Tragic 7.8% |
| Ghanaians | 0.0 /100 | #292 | Tragic 7.8% |
| Immigrants | Cameroon | 0.0 /100 | #293 | Tragic 7.9% |
| Apache | 0.0 /100 | #294 | Tragic 7.9% |
| Barbadians | 0.0 /100 | #295 | Tragic 7.9% |
| Immigrants | Latin America | 0.0 /100 | #296 | Tragic 7.9% |
| Hispanics or Latinos | 0.0 /100 | #297 | Tragic 7.9% |
| Immigrants | West Indies | 0.0 /100 | #298 | Tragic 7.9% |
| Houma | 0.0 /100 | #299 | Tragic 7.9% |
| Mexicans | 0.0 /100 | #300 | Tragic 8.0% |
| Chippewa | 0.0 /100 | #301 | Tragic 8.0% |
| Immigrants | Ghana | 0.0 /100 | #302 | Tragic 8.0% |