Ecuadorian vs Czech Single Mother Households
COMPARE
Ecuadorian
Czech
Single Mother Households
Single Mother Households Comparison
Ecuadorians
Czechs
7.2%
SINGLE MOTHER HOUSEHOLDS
0.6/ 100
METRIC RATING
243rd/ 347
METRIC RANK
5.6%
SINGLE MOTHER HOUSEHOLDS
97.9/ 100
METRIC RATING
80th/ 347
METRIC RANK
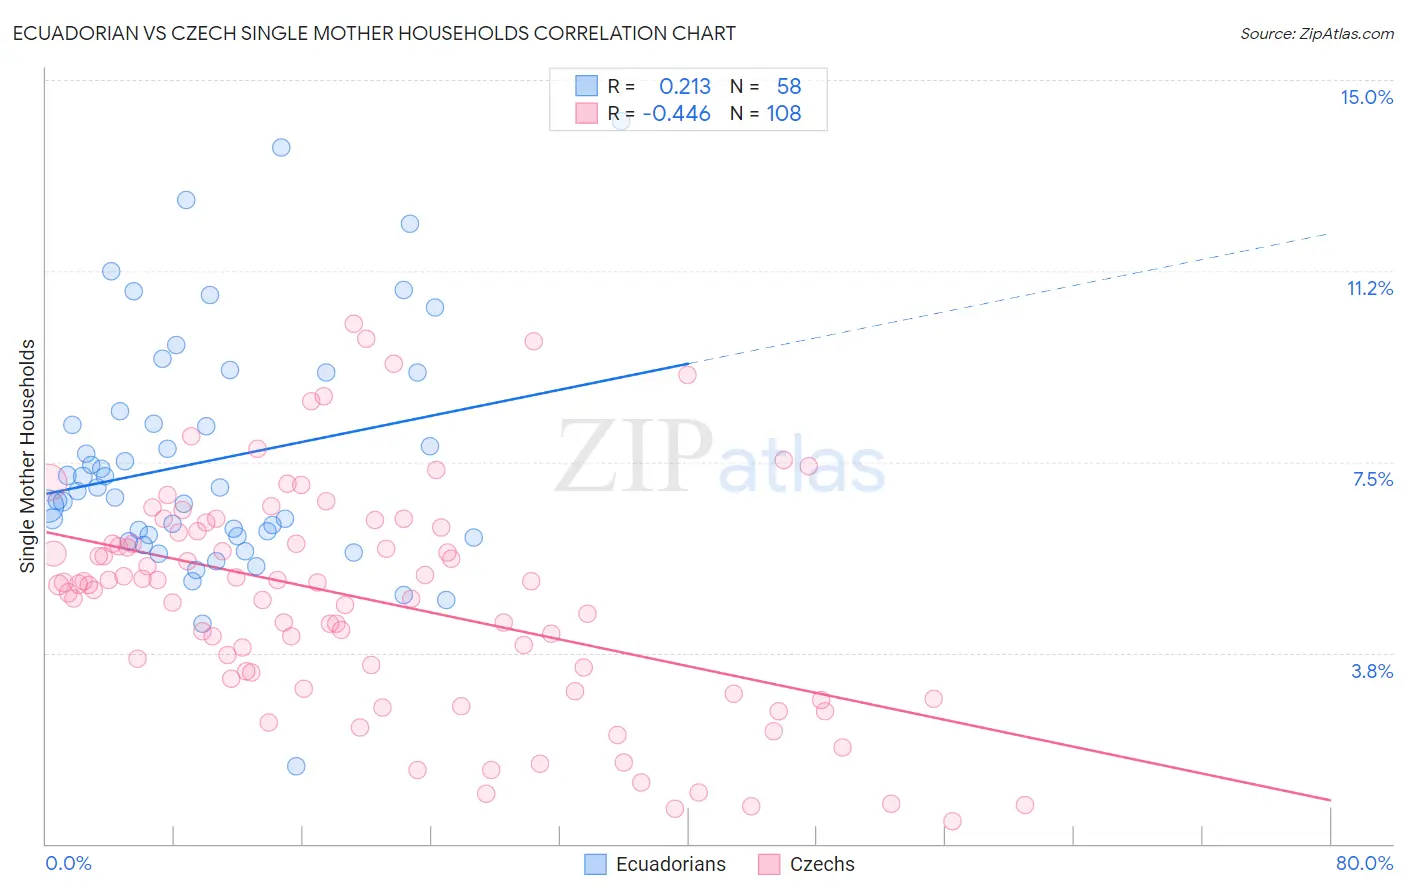
Ecuadorian vs Czech Single Mother Households Correlation Chart
The statistical analysis conducted on geographies consisting of 317,272,224 people shows a weak positive correlation between the proportion of Ecuadorians and percentage of single mother households in the United States with a correlation coefficient (R) of 0.213 and weighted average of 7.2%. Similarly, the statistical analysis conducted on geographies consisting of 482,317,473 people shows a moderate negative correlation between the proportion of Czechs and percentage of single mother households in the United States with a correlation coefficient (R) of -0.446 and weighted average of 5.6%, a difference of 27.5%.
Single Mother Households Correlation Summary
| Measurement | Ecuadorian | Czech |
| Minimum | 1.5% | 0.43% |
| Maximum | 14.2% | 10.2% |
| Range | 12.7% | 9.8% |
| Mean | 7.5% | 4.8% |
| Median | 7.0% | 5.1% |
| Interquartile 25% (IQ1) | 6.0% | 3.3% |
| Interquartile 75% (IQ3) | 8.5% | 6.1% |
| Interquartile Range (IQR) | 2.5% | 2.8% |
| Standard Deviation (Sample) | 2.4% | 2.2% |
| Standard Deviation (Population) | 2.4% | 2.2% |
Similar Demographics by Single Mother Households
Demographics Similar to Ecuadorians by Single Mother Households
In terms of single mother households, the demographic groups most similar to Ecuadorians are Fijian (7.2%, a difference of 0.050%), Cuban (7.2%, a difference of 0.070%), Immigrants from Portugal (7.2%, a difference of 0.13%), Immigrants from Cambodia (7.2%, a difference of 0.41%), and Immigrants from Panama (7.2%, a difference of 0.48%).
| Demographics | Rating | Rank | Single Mother Households |
| Ute | 1.0 /100 | #236 | Tragic 7.1% |
| Arapaho | 1.0 /100 | #237 | Tragic 7.1% |
| Panamanians | 0.9 /100 | #238 | Tragic 7.1% |
| Kiowa | 0.8 /100 | #239 | Tragic 7.1% |
| Immigrants | Panama | 0.7 /100 | #240 | Tragic 7.2% |
| Immigrants | Portugal | 0.6 /100 | #241 | Tragic 7.2% |
| Fijians | 0.6 /100 | #242 | Tragic 7.2% |
| Ecuadorians | 0.6 /100 | #243 | Tragic 7.2% |
| Cubans | 0.6 /100 | #244 | Tragic 7.2% |
| Immigrants | Cambodia | 0.5 /100 | #245 | Tragic 7.2% |
| Nicaraguans | 0.5 /100 | #246 | Tragic 7.2% |
| Dutch West Indians | 0.4 /100 | #247 | Tragic 7.3% |
| Spanish American Indians | 0.4 /100 | #248 | Tragic 7.3% |
| Bermudans | 0.4 /100 | #249 | Tragic 7.3% |
| Immigrants | Africa | 0.4 /100 | #250 | Tragic 7.3% |
Demographics Similar to Czechs by Single Mother Households
In terms of single mother households, the demographic groups most similar to Czechs are Immigrants from Moldova (5.6%, a difference of 0.0%), Immigrants from Sri Lanka (5.6%, a difference of 0.11%), Immigrants from Malaysia (5.7%, a difference of 0.22%), Immigrants from Hungary (5.7%, a difference of 0.24%), and Romanian (5.6%, a difference of 0.31%).
| Demographics | Rating | Rank | Single Mother Households |
| Immigrants | Asia | 98.4 /100 | #73 | Exceptional 5.6% |
| Immigrants | North America | 98.3 /100 | #74 | Exceptional 5.6% |
| Slovenes | 98.3 /100 | #75 | Exceptional 5.6% |
| New Zealanders | 98.2 /100 | #76 | Exceptional 5.6% |
| Romanians | 98.1 /100 | #77 | Exceptional 5.6% |
| Swiss | 98.1 /100 | #78 | Exceptional 5.6% |
| Immigrants | Sri Lanka | 98.0 /100 | #79 | Exceptional 5.6% |
| Czechs | 97.9 /100 | #80 | Exceptional 5.6% |
| Immigrants | Moldova | 97.9 /100 | #81 | Exceptional 5.6% |
| Immigrants | Malaysia | 97.8 /100 | #82 | Exceptional 5.7% |
| Immigrants | Hungary | 97.8 /100 | #83 | Exceptional 5.7% |
| Carpatho Rusyns | 97.7 /100 | #84 | Exceptional 5.7% |
| Hungarians | 97.6 /100 | #85 | Exceptional 5.7% |
| Finns | 97.6 /100 | #86 | Exceptional 5.7% |
| Immigrants | Turkey | 97.5 /100 | #87 | Exceptional 5.7% |