English vs Spanish American Indian Currently Married
COMPARE
English
Spanish American Indian
Currently Married
Currently Married Comparison
English
Spanish American Indians
49.7%
CURRENTLY MARRIED
99.9/ 100
METRIC RATING
11th/ 347
METRIC RANK
43.6%
CURRENTLY MARRIED
0.1/ 100
METRIC RATING
268th/ 347
METRIC RANK
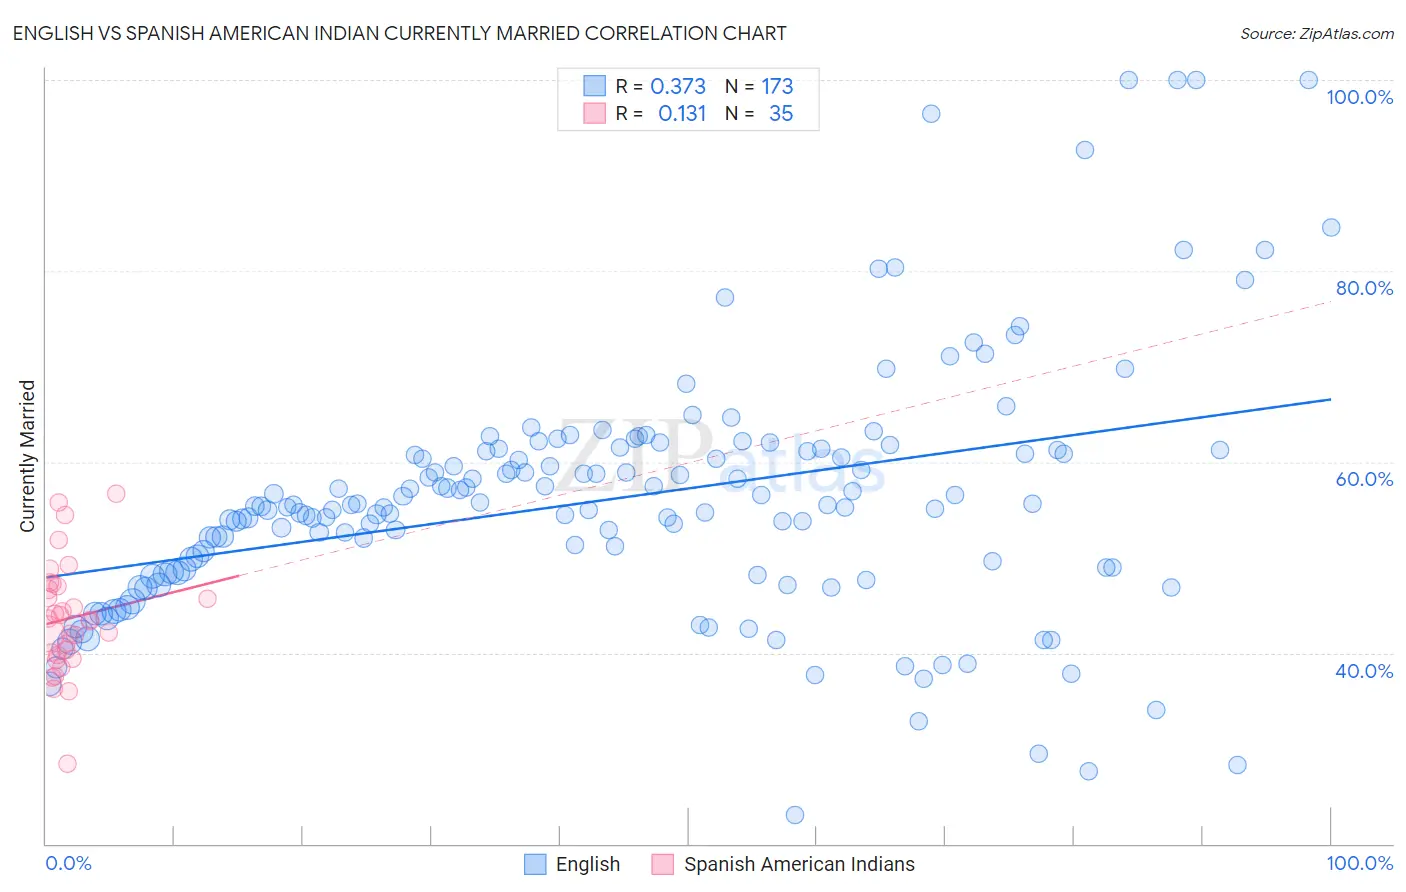
English vs Spanish American Indian Currently Married Correlation Chart
The statistical analysis conducted on geographies consisting of 579,833,471 people shows a mild positive correlation between the proportion of English and percentage of population currently married in the United States with a correlation coefficient (R) of 0.373 and weighted average of 49.7%. Similarly, the statistical analysis conducted on geographies consisting of 73,150,359 people shows a poor positive correlation between the proportion of Spanish American Indians and percentage of population currently married in the United States with a correlation coefficient (R) of 0.131 and weighted average of 43.6%, a difference of 14.1%.
Currently Married Correlation Summary
| Measurement | English | Spanish American Indian |
| Minimum | 23.0% | 28.4% |
| Maximum | 100.0% | 56.6% |
| Range | 77.0% | 28.2% |
| Mean | 56.1% | 43.6% |
| Median | 55.3% | 43.4% |
| Interquartile 25% (IQ1) | 48.4% | 39.8% |
| Interquartile 75% (IQ3) | 61.2% | 47.0% |
| Interquartile Range (IQR) | 12.7% | 7.2% |
| Standard Deviation (Sample) | 13.2% | 5.8% |
| Standard Deviation (Population) | 13.1% | 5.7% |
Similar Demographics by Currently Married
Demographics Similar to English by Currently Married
In terms of currently married, the demographic groups most similar to English are Swiss (49.7%, a difference of 0.0%), Filipino (49.7%, a difference of 0.010%), Dutch (49.6%, a difference of 0.26%), Czech (49.9%, a difference of 0.27%), and German (49.6%, a difference of 0.28%).
| Demographics | Rating | Rank | Currently Married |
| Immigrants | Taiwan | 100.0 /100 | #4 | Exceptional 50.7% |
| Danes | 100.0 /100 | #5 | Exceptional 50.5% |
| Norwegians | 100.0 /100 | #6 | Exceptional 50.2% |
| Immigrants | South Central Asia | 100.0 /100 | #7 | Exceptional 50.0% |
| Swedes | 100.0 /100 | #8 | Exceptional 50.0% |
| Czechs | 99.9 /100 | #9 | Exceptional 49.9% |
| Filipinos | 99.9 /100 | #10 | Exceptional 49.7% |
| English | 99.9 /100 | #11 | Exceptional 49.7% |
| Swiss | 99.9 /100 | #12 | Exceptional 49.7% |
| Dutch | 99.9 /100 | #13 | Exceptional 49.6% |
| Germans | 99.9 /100 | #14 | Exceptional 49.6% |
| Pennsylvania Germans | 99.9 /100 | #15 | Exceptional 49.6% |
| Chinese | 99.9 /100 | #16 | Exceptional 49.5% |
| Scandinavians | 99.9 /100 | #17 | Exceptional 49.5% |
| Immigrants | Scotland | 99.8 /100 | #18 | Exceptional 49.3% |
Demographics Similar to Spanish American Indians by Currently Married
In terms of currently married, the demographic groups most similar to Spanish American Indians are Immigrants from Eritrea (43.6%, a difference of 0.0%), Ecuadorian (43.6%, a difference of 0.030%), Immigrants from Bangladesh (43.6%, a difference of 0.10%), Immigrants from Sudan (43.5%, a difference of 0.12%), and Sudanese (43.7%, a difference of 0.18%).
| Demographics | Rating | Rank | Currently Married |
| Immigrants | Nicaragua | 0.1 /100 | #261 | Tragic 43.7% |
| Bangladeshis | 0.1 /100 | #262 | Tragic 43.7% |
| Immigrants | Cuba | 0.1 /100 | #263 | Tragic 43.7% |
| Sudanese | 0.1 /100 | #264 | Tragic 43.7% |
| Immigrants | Bangladesh | 0.1 /100 | #265 | Tragic 43.6% |
| Ecuadorians | 0.1 /100 | #266 | Tragic 43.6% |
| Immigrants | Eritrea | 0.1 /100 | #267 | Tragic 43.6% |
| Spanish American Indians | 0.1 /100 | #268 | Tragic 43.6% |
| Immigrants | Sudan | 0.1 /100 | #269 | Tragic 43.5% |
| Salvadorans | 0.1 /100 | #270 | Tragic 43.5% |
| Bermudans | 0.1 /100 | #271 | Tragic 43.5% |
| Indonesians | 0.1 /100 | #272 | Tragic 43.5% |
| Yaqui | 0.1 /100 | #273 | Tragic 43.4% |
| Nigerians | 0.1 /100 | #274 | Tragic 43.4% |
| Colville | 0.1 /100 | #275 | Tragic 43.4% |