Immigrants from Czechoslovakia vs Spanish American Indian Currently Married
COMPARE
Immigrants from Czechoslovakia
Spanish American Indian
Currently Married
Currently Married Comparison
Immigrants from Czechoslovakia
Spanish American Indians
48.4%
CURRENTLY MARRIED
98.3/ 100
METRIC RATING
64th/ 347
METRIC RANK
43.6%
CURRENTLY MARRIED
0.1/ 100
METRIC RATING
268th/ 347
METRIC RANK
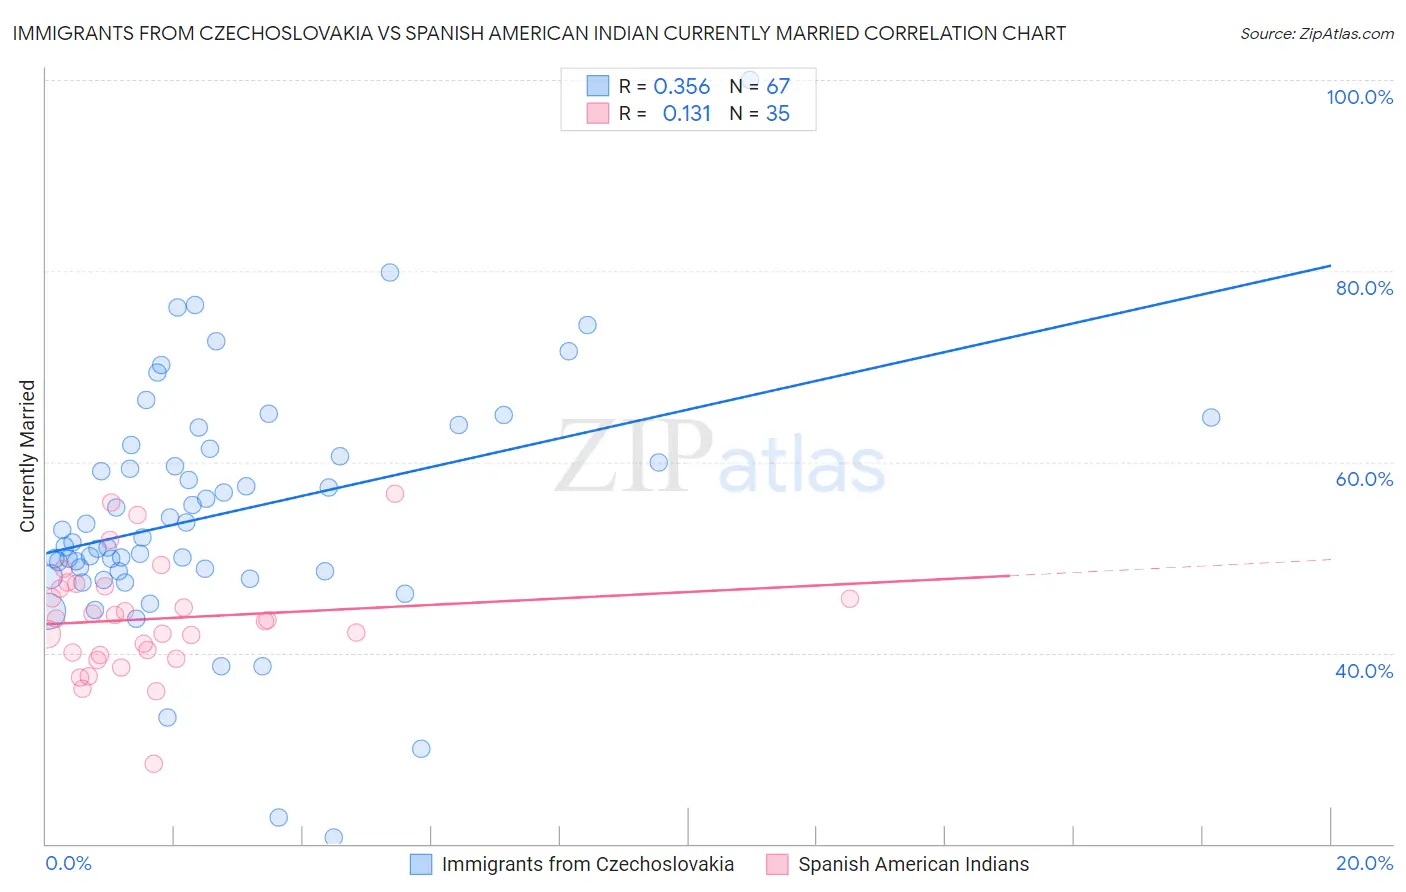
Immigrants from Czechoslovakia vs Spanish American Indian Currently Married Correlation Chart
The statistical analysis conducted on geographies consisting of 195,455,997 people shows a mild positive correlation between the proportion of Immigrants from Czechoslovakia and percentage of population currently married in the United States with a correlation coefficient (R) of 0.356 and weighted average of 48.4%. Similarly, the statistical analysis conducted on geographies consisting of 73,150,359 people shows a poor positive correlation between the proportion of Spanish American Indians and percentage of population currently married in the United States with a correlation coefficient (R) of 0.131 and weighted average of 43.6%, a difference of 11.0%.
Currently Married Correlation Summary
| Measurement | Immigrants from Czechoslovakia | Spanish American Indian |
| Minimum | 20.6% | 28.4% |
| Maximum | 100.0% | 56.6% |
| Range | 79.4% | 28.2% |
| Mean | 54.6% | 43.6% |
| Median | 52.0% | 43.4% |
| Interquartile 25% (IQ1) | 48.5% | 39.8% |
| Interquartile 75% (IQ3) | 61.4% | 47.0% |
| Interquartile Range (IQR) | 12.9% | 7.2% |
| Standard Deviation (Sample) | 12.8% | 5.8% |
| Standard Deviation (Population) | 12.7% | 5.7% |
Similar Demographics by Currently Married
Demographics Similar to Immigrants from Czechoslovakia by Currently Married
In terms of currently married, the demographic groups most similar to Immigrants from Czechoslovakia are Slavic (48.4%, a difference of 0.0%), Ukrainian (48.4%, a difference of 0.010%), Tongan (48.3%, a difference of 0.030%), Slovak (48.3%, a difference of 0.050%), and Immigrants from England (48.3%, a difference of 0.060%).
| Demographics | Rating | Rank | Currently Married |
| Immigrants | Netherlands | 98.6 /100 | #57 | Exceptional 48.5% |
| French | 98.6 /100 | #58 | Exceptional 48.4% |
| Immigrants | Ireland | 98.5 /100 | #59 | Exceptional 48.4% |
| Immigrants | Romania | 98.5 /100 | #60 | Exceptional 48.4% |
| Romanians | 98.5 /100 | #61 | Exceptional 48.4% |
| Asians | 98.5 /100 | #62 | Exceptional 48.4% |
| Slavs | 98.3 /100 | #63 | Exceptional 48.4% |
| Immigrants | Czechoslovakia | 98.3 /100 | #64 | Exceptional 48.4% |
| Ukrainians | 98.3 /100 | #65 | Exceptional 48.4% |
| Tongans | 98.2 /100 | #66 | Exceptional 48.3% |
| Slovaks | 98.2 /100 | #67 | Exceptional 48.3% |
| Immigrants | England | 98.2 /100 | #68 | Exceptional 48.3% |
| Canadians | 98.1 /100 | #69 | Exceptional 48.3% |
| Immigrants | Asia | 97.9 /100 | #70 | Exceptional 48.3% |
| Macedonians | 97.9 /100 | #71 | Exceptional 48.3% |
Demographics Similar to Spanish American Indians by Currently Married
In terms of currently married, the demographic groups most similar to Spanish American Indians are Immigrants from Eritrea (43.6%, a difference of 0.0%), Ecuadorian (43.6%, a difference of 0.030%), Immigrants from Bangladesh (43.6%, a difference of 0.10%), Immigrants from Sudan (43.5%, a difference of 0.12%), and Sudanese (43.7%, a difference of 0.18%).
| Demographics | Rating | Rank | Currently Married |
| Immigrants | Nicaragua | 0.1 /100 | #261 | Tragic 43.7% |
| Bangladeshis | 0.1 /100 | #262 | Tragic 43.7% |
| Immigrants | Cuba | 0.1 /100 | #263 | Tragic 43.7% |
| Sudanese | 0.1 /100 | #264 | Tragic 43.7% |
| Immigrants | Bangladesh | 0.1 /100 | #265 | Tragic 43.6% |
| Ecuadorians | 0.1 /100 | #266 | Tragic 43.6% |
| Immigrants | Eritrea | 0.1 /100 | #267 | Tragic 43.6% |
| Spanish American Indians | 0.1 /100 | #268 | Tragic 43.6% |
| Immigrants | Sudan | 0.1 /100 | #269 | Tragic 43.5% |
| Salvadorans | 0.1 /100 | #270 | Tragic 43.5% |
| Bermudans | 0.1 /100 | #271 | Tragic 43.5% |
| Indonesians | 0.1 /100 | #272 | Tragic 43.5% |
| Yaqui | 0.1 /100 | #273 | Tragic 43.4% |
| Nigerians | 0.1 /100 | #274 | Tragic 43.4% |
| Colville | 0.1 /100 | #275 | Tragic 43.4% |