Dominican vs Immigrants from Oceania Family Households
COMPARE
Dominican
Immigrants from Oceania
Family Households
Family Households Comparison
Dominicans
Immigrants from Oceania
63.4%
FAMILY HOUSEHOLDS
1.5/ 100
METRIC RATING
248th/ 347
METRIC RANK
64.9%
FAMILY HOUSEHOLDS
94.2/ 100
METRIC RATING
120th/ 347
METRIC RANK
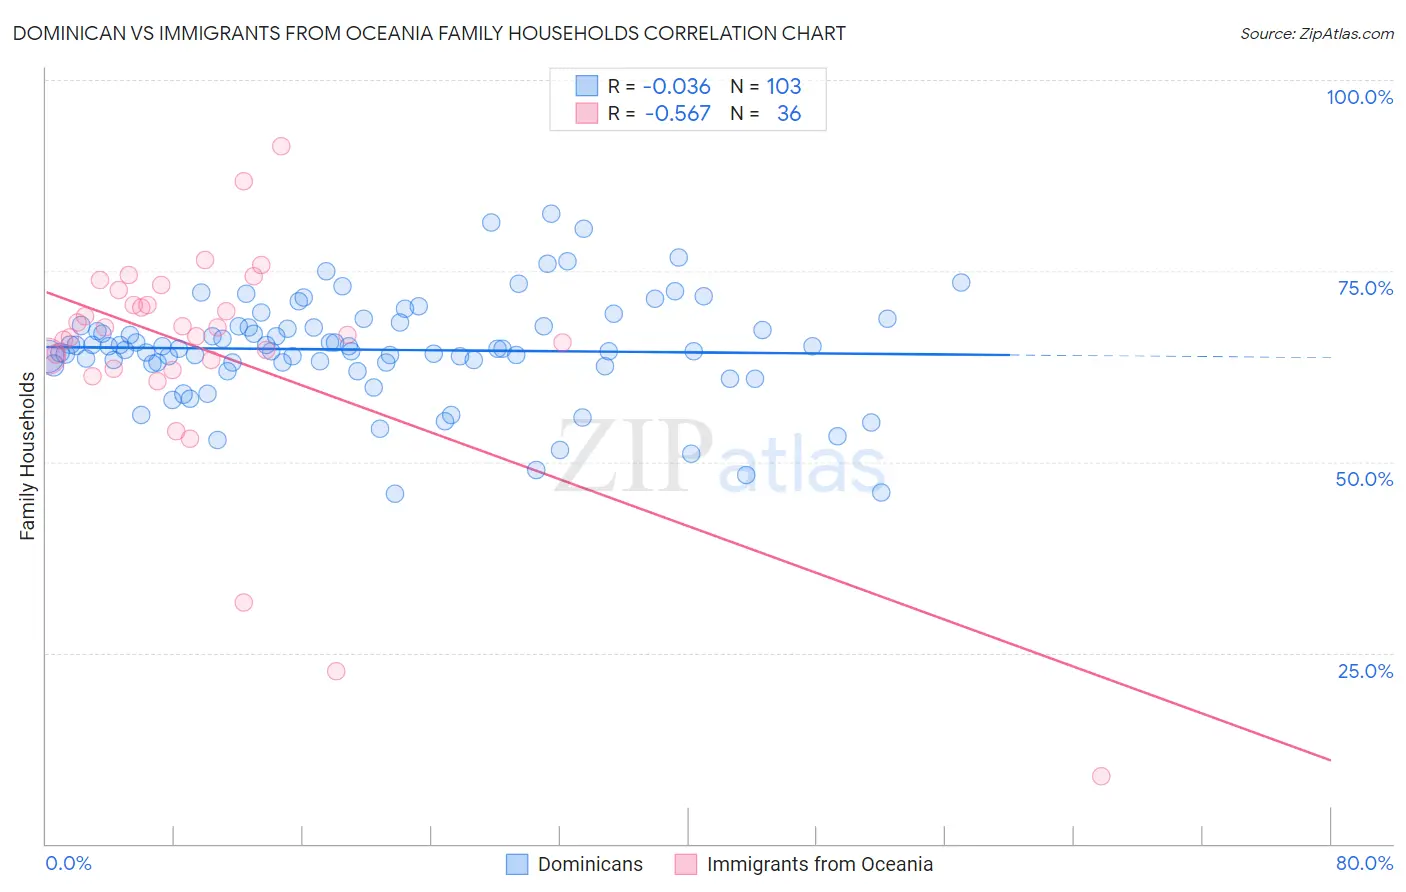
Dominican vs Immigrants from Oceania Family Households Correlation Chart
The statistical analysis conducted on geographies consisting of 354,767,002 people shows no correlation between the proportion of Dominicans and percentage of family households in the United States with a correlation coefficient (R) of -0.036 and weighted average of 63.4%. Similarly, the statistical analysis conducted on geographies consisting of 305,389,085 people shows a substantial negative correlation between the proportion of Immigrants from Oceania and percentage of family households in the United States with a correlation coefficient (R) of -0.567 and weighted average of 64.9%, a difference of 2.4%.
Family Households Correlation Summary
| Measurement | Dominican | Immigrants from Oceania |
| Minimum | 45.8% | 8.8% |
| Maximum | 82.4% | 91.4% |
| Range | 36.6% | 82.6% |
| Mean | 64.7% | 64.5% |
| Median | 64.9% | 67.1% |
| Interquartile 25% (IQ1) | 62.9% | 62.7% |
| Interquartile 75% (IQ3) | 67.7% | 71.6% |
| Interquartile Range (IQR) | 4.8% | 8.8% |
| Standard Deviation (Sample) | 6.8% | 15.4% |
| Standard Deviation (Population) | 6.8% | 15.2% |
Similar Demographics by Family Households
Demographics Similar to Dominicans by Family Households
In terms of family households, the demographic groups most similar to Dominicans are Immigrants from Uzbekistan (63.4%, a difference of 0.010%), Russian (63.4%, a difference of 0.010%), Immigrants from Ghana (63.4%, a difference of 0.020%), Immigrants from Japan (63.4%, a difference of 0.030%), and Eastern European (63.4%, a difference of 0.040%).
| Demographics | Rating | Rank | Family Households |
| Immigrants | St. Vincent and the Grenadines | 1.9 /100 | #241 | Tragic 63.4% |
| Immigrants | Israel | 1.8 /100 | #242 | Tragic 63.4% |
| Immigrants | Czechoslovakia | 1.8 /100 | #243 | Tragic 63.4% |
| Eastern Europeans | 1.6 /100 | #244 | Tragic 63.4% |
| Immigrants | Dominica | 1.6 /100 | #245 | Tragic 63.4% |
| Immigrants | Ghana | 1.6 /100 | #246 | Tragic 63.4% |
| Immigrants | Uzbekistan | 1.5 /100 | #247 | Tragic 63.4% |
| Dominicans | 1.5 /100 | #248 | Tragic 63.4% |
| Russians | 1.4 /100 | #249 | Tragic 63.4% |
| Immigrants | Japan | 1.4 /100 | #250 | Tragic 63.4% |
| Taiwanese | 1.2 /100 | #251 | Tragic 63.3% |
| Bahamians | 1.1 /100 | #252 | Tragic 63.3% |
| Immigrants | Dominican Republic | 1.0 /100 | #253 | Tragic 63.3% |
| Slovaks | 1.0 /100 | #254 | Tragic 63.3% |
| Potawatomi | 1.0 /100 | #255 | Tragic 63.3% |
Demographics Similar to Immigrants from Oceania by Family Households
In terms of family households, the demographic groups most similar to Immigrants from Oceania are Immigrants from Eastern Asia (64.9%, a difference of 0.010%), Hungarian (64.9%, a difference of 0.010%), Hmong (64.9%, a difference of 0.050%), Choctaw (64.9%, a difference of 0.050%), and Dutch (64.9%, a difference of 0.060%).
| Demographics | Rating | Rank | Family Households |
| Spanish | 96.2 /100 | #113 | Exceptional 65.0% |
| Argentineans | 95.7 /100 | #114 | Exceptional 65.0% |
| Ecuadorians | 95.4 /100 | #115 | Exceptional 65.0% |
| Immigrants | Iraq | 95.4 /100 | #116 | Exceptional 65.0% |
| Cherokee | 95.3 /100 | #117 | Exceptional 65.0% |
| Dutch | 95.1 /100 | #118 | Exceptional 64.9% |
| Immigrants | Eastern Asia | 94.4 /100 | #119 | Exceptional 64.9% |
| Immigrants | Oceania | 94.2 /100 | #120 | Exceptional 64.9% |
| Hungarians | 94.0 /100 | #121 | Exceptional 64.9% |
| Hmong | 93.4 /100 | #122 | Exceptional 64.9% |
| Choctaw | 93.4 /100 | #123 | Exceptional 64.9% |
| Immigrants | Argentina | 92.8 /100 | #124 | Exceptional 64.9% |
| Immigrants | Belize | 92.7 /100 | #125 | Exceptional 64.9% |
| Panamanians | 92.4 /100 | #126 | Exceptional 64.8% |
| Immigrants | Panama | 92.0 /100 | #127 | Exceptional 64.8% |