Dominican vs Yup'ik Family Households
COMPARE
Dominican
Yup'ik
Family Households
Family Households Comparison
Dominicans
Yup'ik
63.4%
FAMILY HOUSEHOLDS
1.5/ 100
METRIC RATING
248th/ 347
METRIC RANK
72.4%
FAMILY HOUSEHOLDS
100/ 100
METRIC RATING
1st/ 347
METRIC RANK
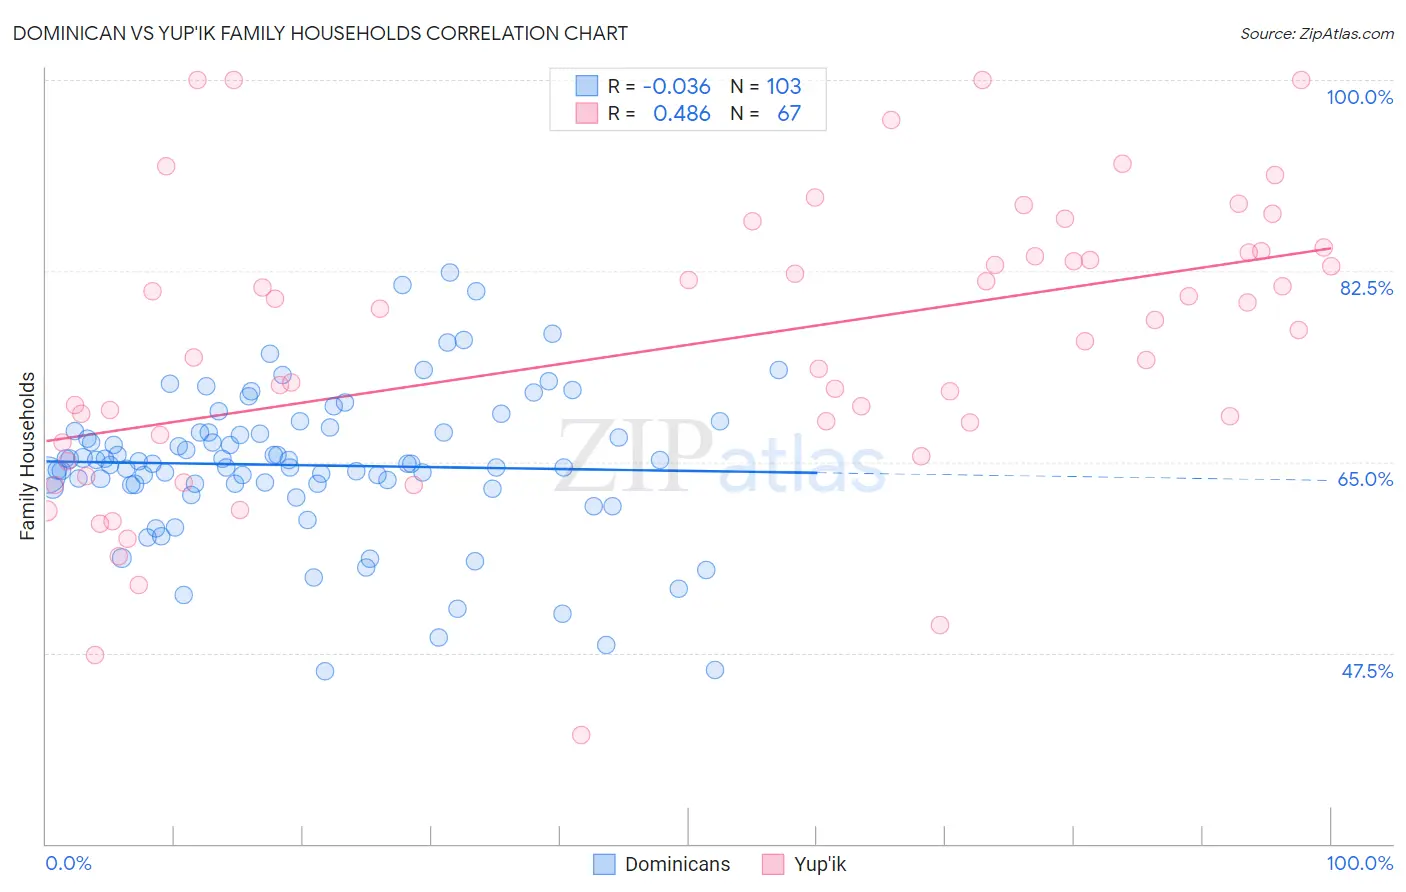
Dominican vs Yup'ik Family Households Correlation Chart
The statistical analysis conducted on geographies consisting of 354,767,002 people shows no correlation between the proportion of Dominicans and percentage of family households in the United States with a correlation coefficient (R) of -0.036 and weighted average of 63.4%. Similarly, the statistical analysis conducted on geographies consisting of 39,956,676 people shows a moderate positive correlation between the proportion of Yup'ik and percentage of family households in the United States with a correlation coefficient (R) of 0.486 and weighted average of 72.4%, a difference of 14.2%.
Family Households Correlation Summary
| Measurement | Dominican | Yup'ik |
| Minimum | 45.8% | 40.0% |
| Maximum | 82.4% | 100.0% |
| Range | 36.6% | 60.0% |
| Mean | 64.7% | 75.6% |
| Median | 64.9% | 77.1% |
| Interquartile 25% (IQ1) | 62.9% | 66.8% |
| Interquartile 75% (IQ3) | 67.7% | 84.2% |
| Interquartile Range (IQR) | 4.8% | 17.4% |
| Standard Deviation (Sample) | 6.8% | 13.2% |
| Standard Deviation (Population) | 6.8% | 13.1% |
Similar Demographics by Family Households
Demographics Similar to Dominicans by Family Households
In terms of family households, the demographic groups most similar to Dominicans are Immigrants from Uzbekistan (63.4%, a difference of 0.010%), Russian (63.4%, a difference of 0.010%), Immigrants from Ghana (63.4%, a difference of 0.020%), Immigrants from Japan (63.4%, a difference of 0.030%), and Eastern European (63.4%, a difference of 0.040%).
| Demographics | Rating | Rank | Family Households |
| Immigrants | St. Vincent and the Grenadines | 1.9 /100 | #241 | Tragic 63.4% |
| Immigrants | Israel | 1.8 /100 | #242 | Tragic 63.4% |
| Immigrants | Czechoslovakia | 1.8 /100 | #243 | Tragic 63.4% |
| Eastern Europeans | 1.6 /100 | #244 | Tragic 63.4% |
| Immigrants | Dominica | 1.6 /100 | #245 | Tragic 63.4% |
| Immigrants | Ghana | 1.6 /100 | #246 | Tragic 63.4% |
| Immigrants | Uzbekistan | 1.5 /100 | #247 | Tragic 63.4% |
| Dominicans | 1.5 /100 | #248 | Tragic 63.4% |
| Russians | 1.4 /100 | #249 | Tragic 63.4% |
| Immigrants | Japan | 1.4 /100 | #250 | Tragic 63.4% |
| Taiwanese | 1.2 /100 | #251 | Tragic 63.3% |
| Bahamians | 1.1 /100 | #252 | Tragic 63.3% |
| Immigrants | Dominican Republic | 1.0 /100 | #253 | Tragic 63.3% |
| Slovaks | 1.0 /100 | #254 | Tragic 63.3% |
| Potawatomi | 1.0 /100 | #255 | Tragic 63.3% |
Demographics Similar to Yup'ik by Family Households
In terms of family households, the demographic groups most similar to Yup'ik are Spanish American Indian (71.2%, a difference of 1.8%), Tongan (69.6%, a difference of 4.0%), Yakama (69.3%, a difference of 4.5%), Yuman (69.3%, a difference of 4.5%), and Immigrants from Mexico (69.1%, a difference of 4.8%).
| Demographics | Rating | Rank | Family Households |
| Yup'ik | 100 /100 | #1 | Exceptional 72.4% |
| Spanish American Indians | 100.0 /100 | #2 | Exceptional 71.2% |
| Tongans | 100.0 /100 | #3 | Exceptional 69.6% |
| Yakama | 100.0 /100 | #4 | Exceptional 69.3% |
| Yuman | 100.0 /100 | #5 | Exceptional 69.3% |
| Immigrants | Mexico | 100.0 /100 | #6 | Exceptional 69.1% |
| Mexicans | 100.0 /100 | #7 | Exceptional 69.0% |
| Immigrants | Fiji | 100.0 /100 | #8 | Exceptional 68.8% |
| Native Hawaiians | 100.0 /100 | #9 | Exceptional 68.4% |
| Immigrants | Philippines | 100.0 /100 | #10 | Exceptional 68.3% |
| Immigrants | Central America | 100.0 /100 | #11 | Exceptional 68.3% |
| Koreans | 100.0 /100 | #12 | Exceptional 68.3% |
| Pueblo | 100.0 /100 | #13 | Exceptional 68.2% |
| Immigrants | Cuba | 100.0 /100 | #14 | Exceptional 68.2% |
| Assyrians/Chaldeans/Syriacs | 100.0 /100 | #15 | Exceptional 68.2% |