Dominican vs American Family Households
COMPARE
Dominican
American
Family Households
Family Households Comparison
Dominicans
Americans
63.4%
FAMILY HOUSEHOLDS
1.5/ 100
METRIC RATING
248th/ 347
METRIC RANK
65.5%
FAMILY HOUSEHOLDS
99.6/ 100
METRIC RATING
84th/ 347
METRIC RANK
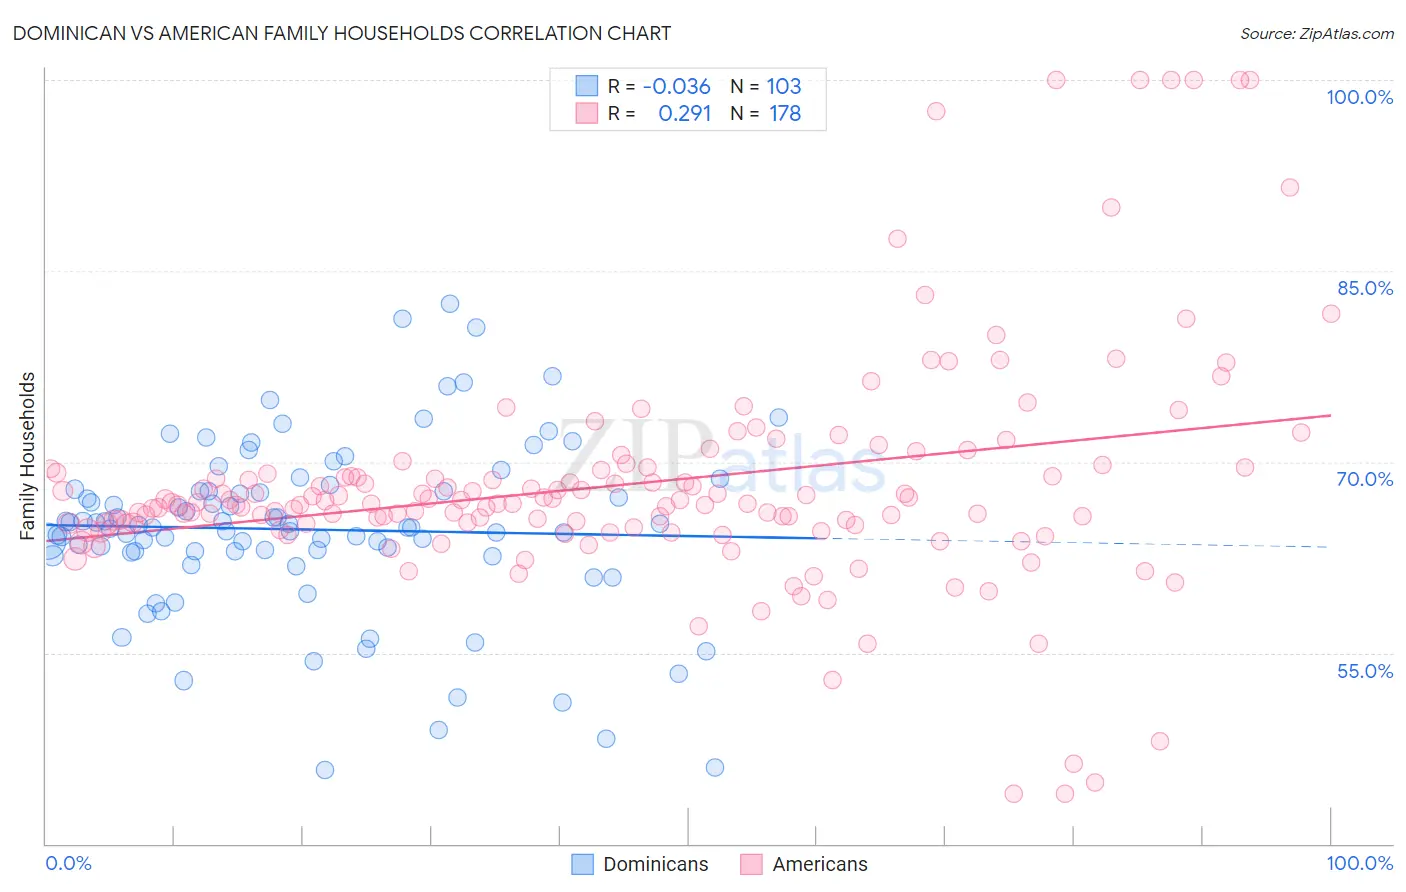
Dominican vs American Family Households Correlation Chart
The statistical analysis conducted on geographies consisting of 354,767,002 people shows no correlation between the proportion of Dominicans and percentage of family households in the United States with a correlation coefficient (R) of -0.036 and weighted average of 63.4%. Similarly, the statistical analysis conducted on geographies consisting of 581,387,036 people shows a weak positive correlation between the proportion of Americans and percentage of family households in the United States with a correlation coefficient (R) of 0.291 and weighted average of 65.5%, a difference of 3.3%.
Family Households Correlation Summary
| Measurement | Dominican | American |
| Minimum | 45.8% | 43.9% |
| Maximum | 82.4% | 100.0% |
| Range | 36.6% | 56.1% |
| Mean | 64.7% | 68.2% |
| Median | 64.9% | 66.7% |
| Interquartile 25% (IQ1) | 62.9% | 65.1% |
| Interquartile 75% (IQ3) | 67.7% | 69.3% |
| Interquartile Range (IQR) | 4.8% | 4.2% |
| Standard Deviation (Sample) | 6.8% | 9.1% |
| Standard Deviation (Population) | 6.8% | 9.1% |
Similar Demographics by Family Households
Demographics Similar to Dominicans by Family Households
In terms of family households, the demographic groups most similar to Dominicans are Immigrants from Uzbekistan (63.4%, a difference of 0.010%), Russian (63.4%, a difference of 0.010%), Immigrants from Ghana (63.4%, a difference of 0.020%), Immigrants from Japan (63.4%, a difference of 0.030%), and Eastern European (63.4%, a difference of 0.040%).
| Demographics | Rating | Rank | Family Households |
| Immigrants | St. Vincent and the Grenadines | 1.9 /100 | #241 | Tragic 63.4% |
| Immigrants | Israel | 1.8 /100 | #242 | Tragic 63.4% |
| Immigrants | Czechoslovakia | 1.8 /100 | #243 | Tragic 63.4% |
| Eastern Europeans | 1.6 /100 | #244 | Tragic 63.4% |
| Immigrants | Dominica | 1.6 /100 | #245 | Tragic 63.4% |
| Immigrants | Ghana | 1.6 /100 | #246 | Tragic 63.4% |
| Immigrants | Uzbekistan | 1.5 /100 | #247 | Tragic 63.4% |
| Dominicans | 1.5 /100 | #248 | Tragic 63.4% |
| Russians | 1.4 /100 | #249 | Tragic 63.4% |
| Immigrants | Japan | 1.4 /100 | #250 | Tragic 63.4% |
| Taiwanese | 1.2 /100 | #251 | Tragic 63.3% |
| Bahamians | 1.1 /100 | #252 | Tragic 63.3% |
| Immigrants | Dominican Republic | 1.0 /100 | #253 | Tragic 63.3% |
| Slovaks | 1.0 /100 | #254 | Tragic 63.3% |
| Potawatomi | 1.0 /100 | #255 | Tragic 63.3% |
Demographics Similar to Americans by Family Households
In terms of family households, the demographic groups most similar to Americans are Immigrants from Guyana (65.5%, a difference of 0.020%), Immigrants from Lebanon (65.5%, a difference of 0.030%), Jordanian (65.5%, a difference of 0.060%), Immigrants from Cambodia (65.4%, a difference of 0.11%), and Puget Sound Salish (65.6%, a difference of 0.14%).
| Demographics | Rating | Rank | Family Households |
| Immigrants | South America | 99.8 /100 | #77 | Exceptional 65.6% |
| Yaqui | 99.8 /100 | #78 | Exceptional 65.6% |
| Immigrants | Costa Rica | 99.8 /100 | #79 | Exceptional 65.6% |
| Puget Sound Salish | 99.8 /100 | #80 | Exceptional 65.6% |
| Jordanians | 99.7 /100 | #81 | Exceptional 65.5% |
| Immigrants | Lebanon | 99.7 /100 | #82 | Exceptional 65.5% |
| Immigrants | Guyana | 99.6 /100 | #83 | Exceptional 65.5% |
| Americans | 99.6 /100 | #84 | Exceptional 65.5% |
| Immigrants | Cambodia | 99.5 /100 | #85 | Exceptional 65.4% |
| Egyptians | 99.4 /100 | #86 | Exceptional 65.4% |
| Immigrants | Egypt | 99.2 /100 | #87 | Exceptional 65.3% |
| Immigrants | Haiti | 99.1 /100 | #88 | Exceptional 65.3% |
| Immigrants | Caribbean | 99.1 /100 | #89 | Exceptional 65.3% |
| Immigrants | Laos | 99.1 /100 | #90 | Exceptional 65.3% |
| Crow | 98.9 /100 | #91 | Exceptional 65.3% |