Dominican vs Immigrants from Australia Divorced or Separated
COMPARE
Dominican
Immigrants from Australia
Divorced or Separated
Divorced or Separated Comparison
Dominicans
Immigrants from Australia
12.7%
DIVORCED OR SEPARATED
0.2/ 100
METRIC RATING
277th/ 347
METRIC RANK
11.3%
DIVORCED OR SEPARATED
99.9/ 100
METRIC RATING
52nd/ 347
METRIC RANK
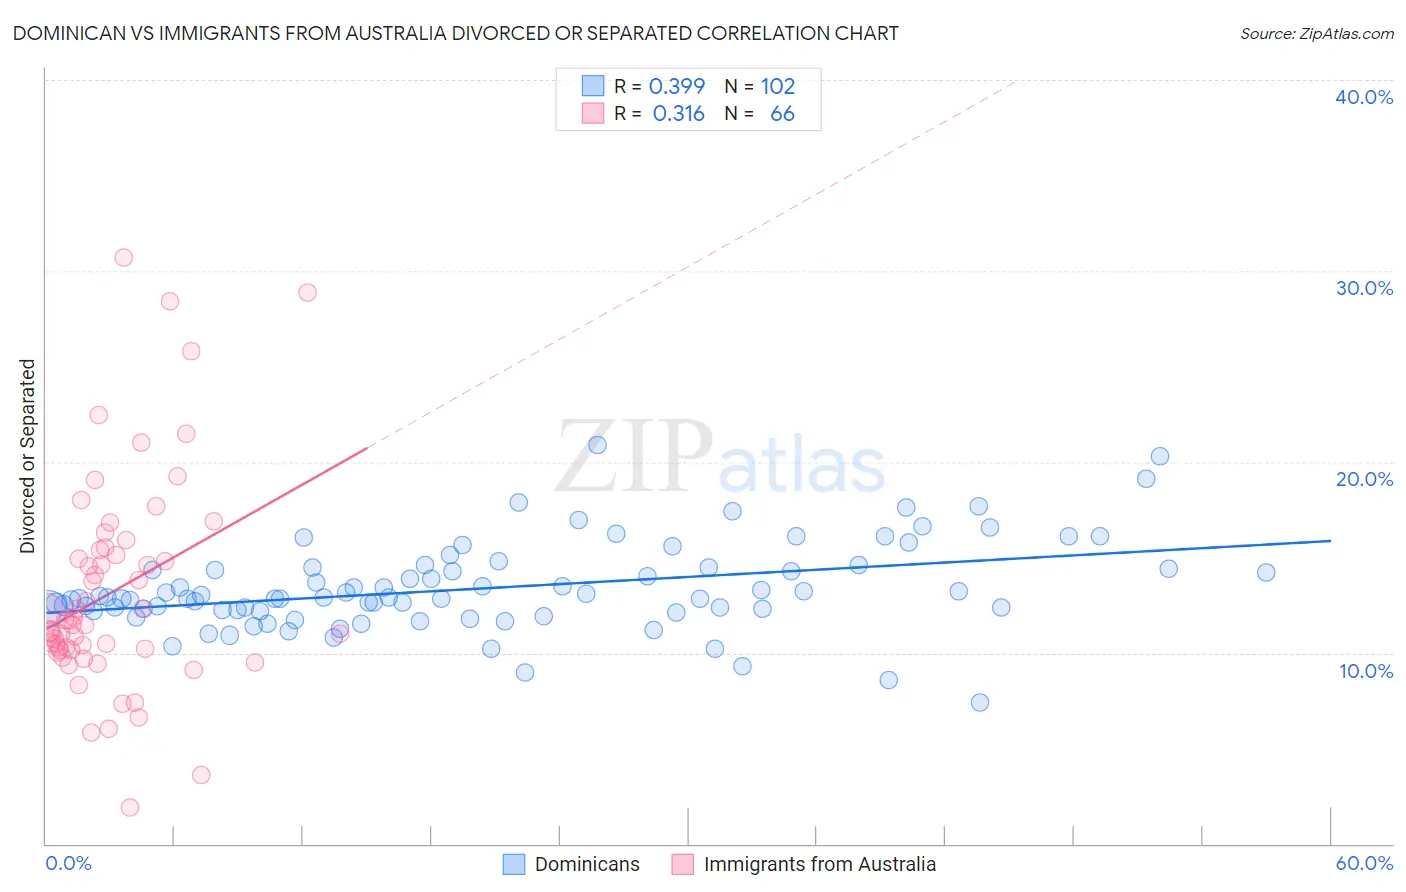
Dominican vs Immigrants from Australia Divorced or Separated Correlation Chart
The statistical analysis conducted on geographies consisting of 354,903,944 people shows a mild positive correlation between the proportion of Dominicans and percentage of population currently divorced or separated in the United States with a correlation coefficient (R) of 0.399 and weighted average of 12.7%. Similarly, the statistical analysis conducted on geographies consisting of 227,153,682 people shows a mild positive correlation between the proportion of Immigrants from Australia and percentage of population currently divorced or separated in the United States with a correlation coefficient (R) of 0.316 and weighted average of 11.3%, a difference of 12.7%.
Divorced or Separated Correlation Summary
| Measurement | Dominican | Immigrants from Australia |
| Minimum | 7.4% | 1.9% |
| Maximum | 20.9% | 30.7% |
| Range | 13.5% | 28.8% |
| Mean | 13.4% | 13.2% |
| Median | 12.9% | 11.6% |
| Interquartile 25% (IQ1) | 12.2% | 10.2% |
| Interquartile 75% (IQ3) | 14.4% | 15.4% |
| Interquartile Range (IQR) | 2.2% | 5.2% |
| Standard Deviation (Sample) | 2.3% | 5.6% |
| Standard Deviation (Population) | 2.3% | 5.5% |
Similar Demographics by Divorced or Separated
Demographics Similar to Dominicans by Divorced or Separated
In terms of divorced or separated, the demographic groups most similar to Dominicans are Spaniard (12.7%, a difference of 0.050%), Central American Indian (12.7%, a difference of 0.11%), Bermudan (12.7%, a difference of 0.14%), Immigrants from Micronesia (12.7%, a difference of 0.15%), and Lumbee (12.7%, a difference of 0.16%).
| Demographics | Rating | Rank | Divorced or Separated |
| Ute | 0.4 /100 | #270 | Tragic 12.6% |
| Panamanians | 0.3 /100 | #271 | Tragic 12.7% |
| Immigrants | Middle Africa | 0.3 /100 | #272 | Tragic 12.7% |
| Immigrants | Micronesia | 0.3 /100 | #273 | Tragic 12.7% |
| Bermudans | 0.3 /100 | #274 | Tragic 12.7% |
| Central American Indians | 0.3 /100 | #275 | Tragic 12.7% |
| Spaniards | 0.2 /100 | #276 | Tragic 12.7% |
| Dominicans | 0.2 /100 | #277 | Tragic 12.7% |
| Lumbee | 0.2 /100 | #278 | Tragic 12.7% |
| Immigrants | Dominican Republic | 0.2 /100 | #279 | Tragic 12.7% |
| Immigrants | Zaire | 0.2 /100 | #280 | Tragic 12.7% |
| Pueblo | 0.2 /100 | #281 | Tragic 12.7% |
| Sub-Saharan Africans | 0.1 /100 | #282 | Tragic 12.7% |
| Delaware | 0.1 /100 | #283 | Tragic 12.7% |
| Immigrants | Nonimmigrants | 0.1 /100 | #284 | Tragic 12.8% |
Demographics Similar to Immigrants from Australia by Divorced or Separated
In terms of divorced or separated, the demographic groups most similar to Immigrants from Australia are Immigrants from Bolivia (11.3%, a difference of 0.11%), Immigrants from Lithuania (11.3%, a difference of 0.23%), Eastern European (11.3%, a difference of 0.34%), Immigrants from Yemen (11.3%, a difference of 0.35%), and Bolivian (11.2%, a difference of 0.40%).
| Demographics | Rating | Rank | Divorced or Separated |
| Turks | 100.0 /100 | #45 | Exceptional 11.2% |
| Laotians | 100.0 /100 | #46 | Exceptional 11.2% |
| Immigrants | Poland | 100.0 /100 | #47 | Exceptional 11.2% |
| Immigrants | Turkey | 100.0 /100 | #48 | Exceptional 11.2% |
| Immigrants | Saudi Arabia | 100.0 /100 | #49 | Exceptional 11.2% |
| Bolivians | 100.0 /100 | #50 | Exceptional 11.2% |
| Immigrants | Bolivia | 100.0 /100 | #51 | Exceptional 11.3% |
| Immigrants | Australia | 99.9 /100 | #52 | Exceptional 11.3% |
| Immigrants | Lithuania | 99.9 /100 | #53 | Exceptional 11.3% |
| Eastern Europeans | 99.9 /100 | #54 | Exceptional 11.3% |
| Immigrants | Yemen | 99.9 /100 | #55 | Exceptional 11.3% |
| Immigrants | Philippines | 99.9 /100 | #56 | Exceptional 11.3% |
| Immigrants | Vietnam | 99.9 /100 | #57 | Exceptional 11.3% |
| Sri Lankans | 99.9 /100 | #58 | Exceptional 11.3% |
| Israelis | 99.9 /100 | #59 | Exceptional 11.3% |