Tongan vs Immigrants from Australia Divorced or Separated
COMPARE
Tongan
Immigrants from Australia
Divorced or Separated
Divorced or Separated Comparison
Tongans
Immigrants from Australia
11.1%
DIVORCED OR SEPARATED
100.0/ 100
METRIC RATING
32nd/ 347
METRIC RANK
11.3%
DIVORCED OR SEPARATED
99.9/ 100
METRIC RATING
52nd/ 347
METRIC RANK
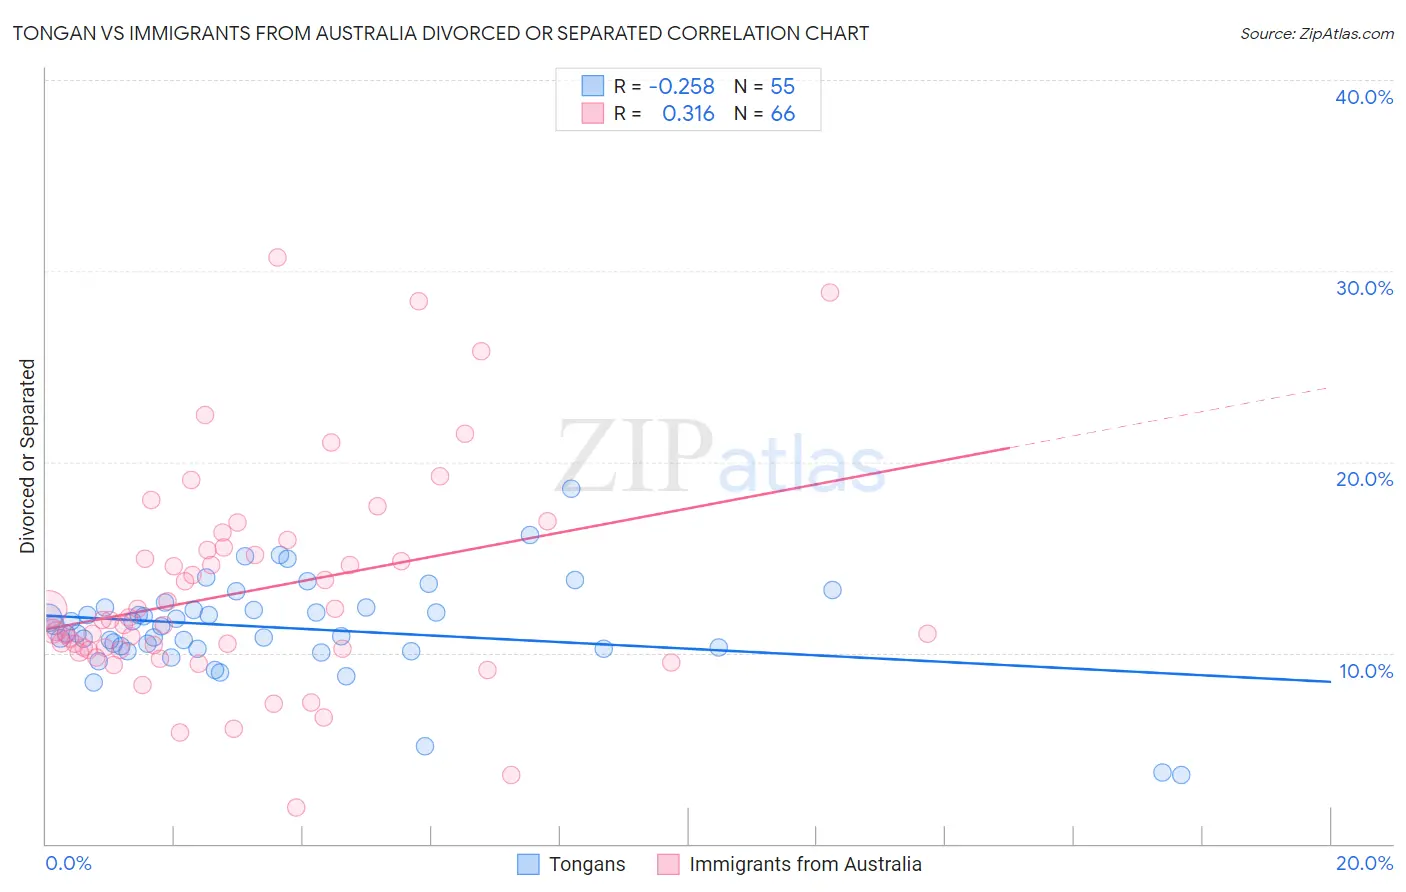
Tongan vs Immigrants from Australia Divorced or Separated Correlation Chart
The statistical analysis conducted on geographies consisting of 102,897,047 people shows a weak negative correlation between the proportion of Tongans and percentage of population currently divorced or separated in the United States with a correlation coefficient (R) of -0.258 and weighted average of 11.1%. Similarly, the statistical analysis conducted on geographies consisting of 227,153,682 people shows a mild positive correlation between the proportion of Immigrants from Australia and percentage of population currently divorced or separated in the United States with a correlation coefficient (R) of 0.316 and weighted average of 11.3%, a difference of 1.7%.
Divorced or Separated Correlation Summary
| Measurement | Tongan | Immigrants from Australia |
| Minimum | 3.6% | 1.9% |
| Maximum | 18.6% | 30.7% |
| Range | 15.0% | 28.8% |
| Mean | 11.3% | 13.2% |
| Median | 11.4% | 11.6% |
| Interquartile 25% (IQ1) | 10.2% | 10.2% |
| Interquartile 75% (IQ3) | 12.4% | 15.4% |
| Interquartile Range (IQR) | 2.1% | 5.2% |
| Standard Deviation (Sample) | 2.6% | 5.6% |
| Standard Deviation (Population) | 2.6% | 5.5% |
Demographics Similar to Tongans and Immigrants from Australia by Divorced or Separated
In terms of divorced or separated, the demographic groups most similar to Tongans are Egyptian (11.1%, a difference of 0.040%), Immigrants from Uzbekistan (11.1%, a difference of 0.12%), Cambodian (11.1%, a difference of 0.20%), Immigrants from Japan (11.1%, a difference of 0.25%), and Immigrants from Lebanon (11.1%, a difference of 0.26%). Similarly, the demographic groups most similar to Immigrants from Australia are Immigrants from Bolivia (11.3%, a difference of 0.11%), Bolivian (11.2%, a difference of 0.40%), Immigrants from Saudi Arabia (11.2%, a difference of 0.47%), Immigrants from Turkey (11.2%, a difference of 0.48%), and Immigrants from Poland (11.2%, a difference of 0.51%).
| Demographics | Rating | Rank | Divorced or Separated |
| Tongans | 100.0 /100 | #32 | Exceptional 11.1% |
| Egyptians | 100.0 /100 | #33 | Exceptional 11.1% |
| Immigrants | Uzbekistan | 100.0 /100 | #34 | Exceptional 11.1% |
| Cambodians | 100.0 /100 | #35 | Exceptional 11.1% |
| Immigrants | Japan | 100.0 /100 | #36 | Exceptional 11.1% |
| Immigrants | Lebanon | 100.0 /100 | #37 | Exceptional 11.1% |
| Immigrants | Greece | 100.0 /100 | #38 | Exceptional 11.1% |
| Immigrants | Egypt | 100.0 /100 | #39 | Exceptional 11.1% |
| Soviet Union | 100.0 /100 | #40 | Exceptional 11.1% |
| Bhutanese | 100.0 /100 | #41 | Exceptional 11.2% |
| Chinese | 100.0 /100 | #42 | Exceptional 11.2% |
| Immigrants | Belarus | 100.0 /100 | #43 | Exceptional 11.2% |
| Immigrants | Western Asia | 100.0 /100 | #44 | Exceptional 11.2% |
| Turks | 100.0 /100 | #45 | Exceptional 11.2% |
| Laotians | 100.0 /100 | #46 | Exceptional 11.2% |
| Immigrants | Poland | 100.0 /100 | #47 | Exceptional 11.2% |
| Immigrants | Turkey | 100.0 /100 | #48 | Exceptional 11.2% |
| Immigrants | Saudi Arabia | 100.0 /100 | #49 | Exceptional 11.2% |
| Bolivians | 100.0 /100 | #50 | Exceptional 11.2% |
| Immigrants | Bolivia | 100.0 /100 | #51 | Exceptional 11.3% |
| Immigrants | Australia | 99.9 /100 | #52 | Exceptional 11.3% |