Dominican vs Senegalese Divorced or Separated
COMPARE
Dominican
Senegalese
Divorced or Separated
Divorced or Separated Comparison
Dominicans
Senegalese
12.7%
DIVORCED OR SEPARATED
0.2/ 100
METRIC RATING
277th/ 347
METRIC RANK
12.6%
DIVORCED OR SEPARATED
0.8/ 100
METRIC RATING
254th/ 347
METRIC RANK
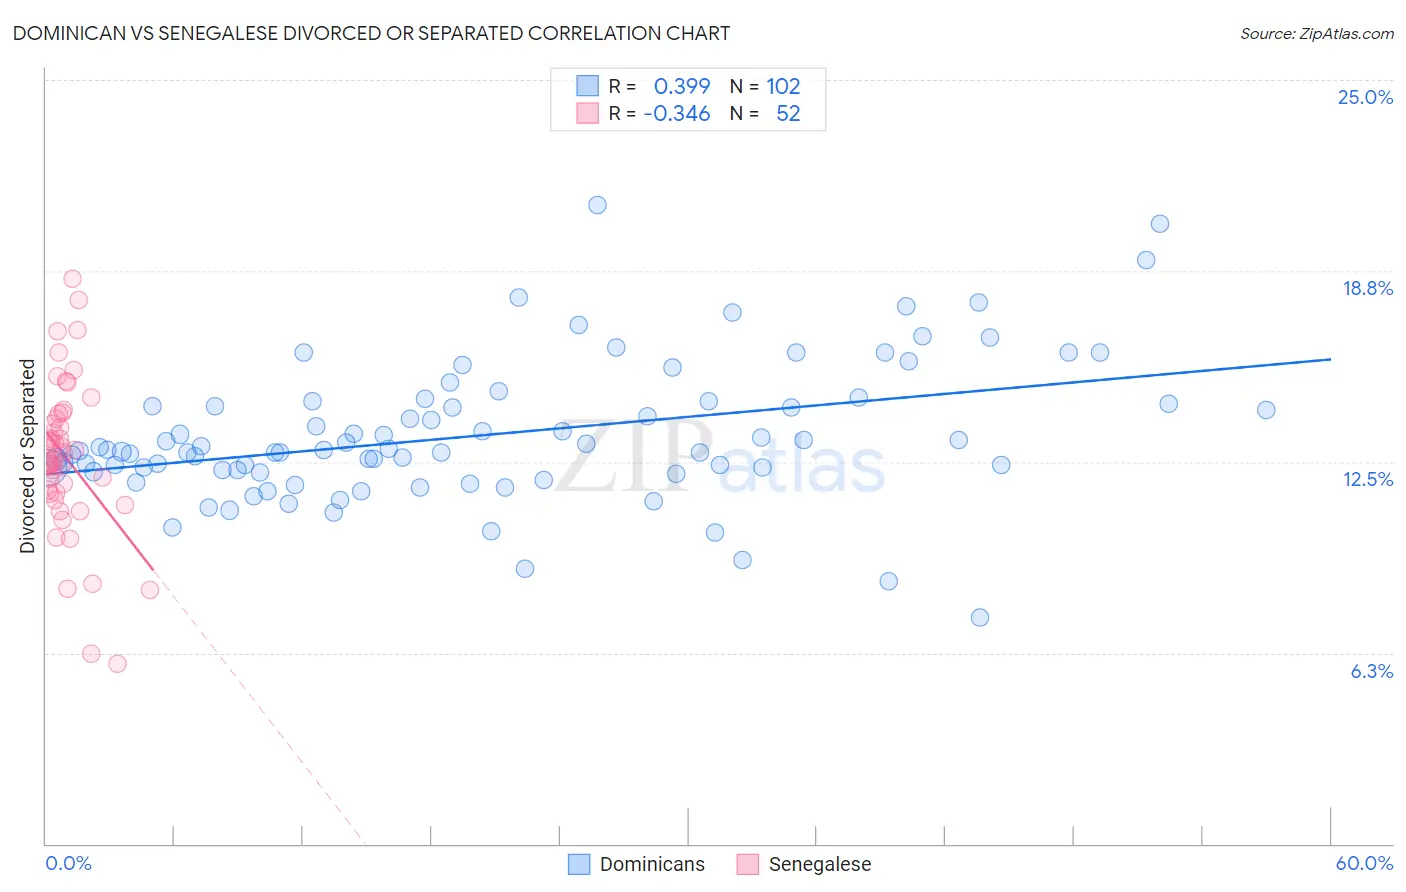
Dominican vs Senegalese Divorced or Separated Correlation Chart
The statistical analysis conducted on geographies consisting of 354,903,944 people shows a mild positive correlation between the proportion of Dominicans and percentage of population currently divorced or separated in the United States with a correlation coefficient (R) of 0.399 and weighted average of 12.7%. Similarly, the statistical analysis conducted on geographies consisting of 78,107,305 people shows a mild negative correlation between the proportion of Senegalese and percentage of population currently divorced or separated in the United States with a correlation coefficient (R) of -0.346 and weighted average of 12.6%, a difference of 1.1%.
Divorced or Separated Correlation Summary
| Measurement | Dominican | Senegalese |
| Minimum | 7.4% | 5.9% |
| Maximum | 20.9% | 18.5% |
| Range | 13.5% | 12.6% |
| Mean | 13.4% | 12.6% |
| Median | 12.9% | 12.5% |
| Interquartile 25% (IQ1) | 12.2% | 11.5% |
| Interquartile 75% (IQ3) | 14.4% | 14.0% |
| Interquartile Range (IQR) | 2.2% | 2.5% |
| Standard Deviation (Sample) | 2.3% | 2.5% |
| Standard Deviation (Population) | 2.3% | 2.5% |
Similar Demographics by Divorced or Separated
Demographics Similar to Dominicans by Divorced or Separated
In terms of divorced or separated, the demographic groups most similar to Dominicans are Spaniard (12.7%, a difference of 0.050%), Central American Indian (12.7%, a difference of 0.11%), Bermudan (12.7%, a difference of 0.14%), Immigrants from Micronesia (12.7%, a difference of 0.15%), and Lumbee (12.7%, a difference of 0.16%).
| Demographics | Rating | Rank | Divorced or Separated |
| Ute | 0.4 /100 | #270 | Tragic 12.6% |
| Panamanians | 0.3 /100 | #271 | Tragic 12.7% |
| Immigrants | Middle Africa | 0.3 /100 | #272 | Tragic 12.7% |
| Immigrants | Micronesia | 0.3 /100 | #273 | Tragic 12.7% |
| Bermudans | 0.3 /100 | #274 | Tragic 12.7% |
| Central American Indians | 0.3 /100 | #275 | Tragic 12.7% |
| Spaniards | 0.2 /100 | #276 | Tragic 12.7% |
| Dominicans | 0.2 /100 | #277 | Tragic 12.7% |
| Lumbee | 0.2 /100 | #278 | Tragic 12.7% |
| Immigrants | Dominican Republic | 0.2 /100 | #279 | Tragic 12.7% |
| Immigrants | Zaire | 0.2 /100 | #280 | Tragic 12.7% |
| Pueblo | 0.2 /100 | #281 | Tragic 12.7% |
| Sub-Saharan Africans | 0.1 /100 | #282 | Tragic 12.7% |
| Delaware | 0.1 /100 | #283 | Tragic 12.7% |
| Immigrants | Nonimmigrants | 0.1 /100 | #284 | Tragic 12.8% |
Demographics Similar to Senegalese by Divorced or Separated
In terms of divorced or separated, the demographic groups most similar to Senegalese are Liberian (12.6%, a difference of 0.060%), Somali (12.6%, a difference of 0.060%), Welsh (12.6%, a difference of 0.10%), Immigrants from Colombia (12.6%, a difference of 0.26%), and Immigrants from Somalia (12.6%, a difference of 0.27%).
| Demographics | Rating | Rank | Divorced or Separated |
| Germans | 1.8 /100 | #247 | Tragic 12.5% |
| Nepalese | 1.8 /100 | #248 | Tragic 12.5% |
| Finns | 1.8 /100 | #249 | Tragic 12.5% |
| Irish | 1.3 /100 | #250 | Tragic 12.5% |
| Aleuts | 1.3 /100 | #251 | Tragic 12.5% |
| Liberians | 0.9 /100 | #252 | Tragic 12.6% |
| Somalis | 0.9 /100 | #253 | Tragic 12.6% |
| Senegalese | 0.8 /100 | #254 | Tragic 12.6% |
| Welsh | 0.7 /100 | #255 | Tragic 12.6% |
| Immigrants | Colombia | 0.6 /100 | #256 | Tragic 12.6% |
| Immigrants | Somalia | 0.6 /100 | #257 | Tragic 12.6% |
| Indonesians | 0.6 /100 | #258 | Tragic 12.6% |
| Yuman | 0.6 /100 | #259 | Tragic 12.6% |
| Immigrants | Uruguay | 0.6 /100 | #260 | Tragic 12.6% |
| Immigrants | Dominica | 0.5 /100 | #261 | Tragic 12.6% |