Dominican vs Immigrants from Australia Doctorate Degree
COMPARE
Dominican
Immigrants from Australia
Doctorate Degree
Doctorate Degree Comparison
Dominicans
Immigrants from Australia
1.4%
DOCTORATE DEGREE
0.1/ 100
METRIC RATING
314th/ 347
METRIC RANK
2.8%
DOCTORATE DEGREE
100.0/ 100
METRIC RATING
17th/ 347
METRIC RANK
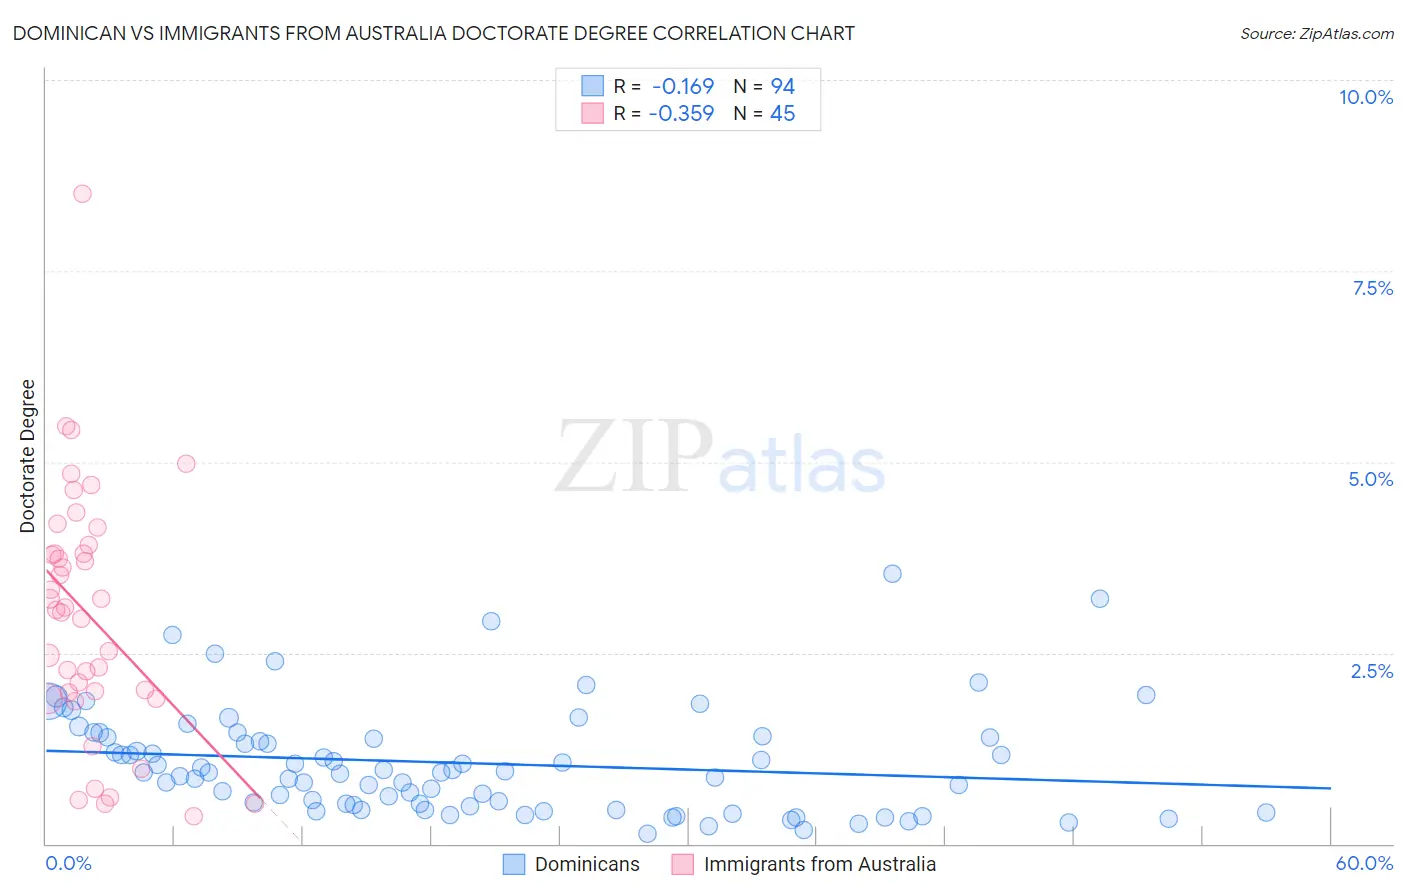
Dominican vs Immigrants from Australia Doctorate Degree Correlation Chart
The statistical analysis conducted on geographies consisting of 351,566,637 people shows a poor negative correlation between the proportion of Dominicans and percentage of population with at least doctorate degree education in the United States with a correlation coefficient (R) of -0.169 and weighted average of 1.4%. Similarly, the statistical analysis conducted on geographies consisting of 226,352,894 people shows a mild negative correlation between the proportion of Immigrants from Australia and percentage of population with at least doctorate degree education in the United States with a correlation coefficient (R) of -0.359 and weighted average of 2.8%, a difference of 107.0%.
Doctorate Degree Correlation Summary
| Measurement | Dominican | Immigrants from Australia |
| Minimum | 0.14% | 0.36% |
| Maximum | 3.5% | 8.5% |
| Range | 3.4% | 8.2% |
| Mean | 1.1% | 3.0% |
| Median | 0.94% | 3.1% |
| Interquartile 25% (IQ1) | 0.51% | 1.9% |
| Interquartile 75% (IQ3) | 1.4% | 3.9% |
| Interquartile Range (IQR) | 0.88% | 1.9% |
| Standard Deviation (Sample) | 0.69% | 1.6% |
| Standard Deviation (Population) | 0.69% | 1.6% |
Similar Demographics by Doctorate Degree
Demographics Similar to Dominicans by Doctorate Degree
In terms of doctorate degree, the demographic groups most similar to Dominicans are Immigrants from the Azores (1.4%, a difference of 0.020%), Menominee (1.4%, a difference of 0.080%), Navajo (1.4%, a difference of 0.23%), Immigrants from Nicaragua (1.4%, a difference of 0.39%), and Immigrants from Micronesia (1.3%, a difference of 0.48%).
| Demographics | Rating | Rank | Doctorate Degree |
| Cubans | 0.1 /100 | #307 | Tragic 1.4% |
| Immigrants | Laos | 0.1 /100 | #308 | Tragic 1.4% |
| Immigrants | Grenada | 0.1 /100 | #309 | Tragic 1.4% |
| Immigrants | Jamaica | 0.1 /100 | #310 | Tragic 1.4% |
| Immigrants | Honduras | 0.1 /100 | #311 | Tragic 1.4% |
| Immigrants | Nicaragua | 0.1 /100 | #312 | Tragic 1.4% |
| Menominee | 0.1 /100 | #313 | Tragic 1.4% |
| Dominicans | 0.1 /100 | #314 | Tragic 1.4% |
| Immigrants | Azores | 0.1 /100 | #315 | Tragic 1.4% |
| Navajo | 0.1 /100 | #316 | Tragic 1.4% |
| Immigrants | Micronesia | 0.1 /100 | #317 | Tragic 1.3% |
| Creek | 0.1 /100 | #318 | Tragic 1.3% |
| Immigrants | Guyana | 0.1 /100 | #319 | Tragic 1.3% |
| Immigrants | St. Vincent and the Grenadines | 0.1 /100 | #320 | Tragic 1.3% |
| Dutch West Indians | 0.1 /100 | #321 | Tragic 1.3% |
Demographics Similar to Immigrants from Australia by Doctorate Degree
In terms of doctorate degree, the demographic groups most similar to Immigrants from Australia are Immigrants from Sri Lanka (2.8%, a difference of 0.24%), Immigrants from Japan (2.8%, a difference of 0.62%), Eastern European (2.8%, a difference of 0.70%), Immigrants from Hong Kong (2.8%, a difference of 0.97%), and Immigrants from India (2.8%, a difference of 1.0%).
| Demographics | Rating | Rank | Doctorate Degree |
| Immigrants | Eastern Asia | 100.0 /100 | #10 | Exceptional 3.0% |
| Indians (Asian) | 100.0 /100 | #11 | Exceptional 2.9% |
| Immigrants | Belgium | 100.0 /100 | #12 | Exceptional 2.9% |
| Immigrants | Sweden | 100.0 /100 | #13 | Exceptional 2.9% |
| Immigrants | France | 100.0 /100 | #14 | Exceptional 2.9% |
| Immigrants | India | 100.0 /100 | #15 | Exceptional 2.8% |
| Eastern Europeans | 100.0 /100 | #16 | Exceptional 2.8% |
| Immigrants | Australia | 100.0 /100 | #17 | Exceptional 2.8% |
| Immigrants | Sri Lanka | 100.0 /100 | #18 | Exceptional 2.8% |
| Immigrants | Japan | 100.0 /100 | #19 | Exceptional 2.8% |
| Immigrants | Hong Kong | 100.0 /100 | #20 | Exceptional 2.8% |
| Thais | 100.0 /100 | #21 | Exceptional 2.8% |
| Mongolians | 100.0 /100 | #22 | Exceptional 2.8% |
| Immigrants | Denmark | 100.0 /100 | #23 | Exceptional 2.8% |
| Israelis | 100.0 /100 | #24 | Exceptional 2.7% |