Swiss vs Immigrants from Australia Divorced or Separated
COMPARE
Swiss
Immigrants from Australia
Divorced or Separated
Divorced or Separated Comparison
Swiss
Immigrants from Australia
12.0%
DIVORCED OR SEPARATED
63.6/ 100
METRIC RATING
164th/ 347
METRIC RANK
11.3%
DIVORCED OR SEPARATED
99.9/ 100
METRIC RATING
52nd/ 347
METRIC RANK
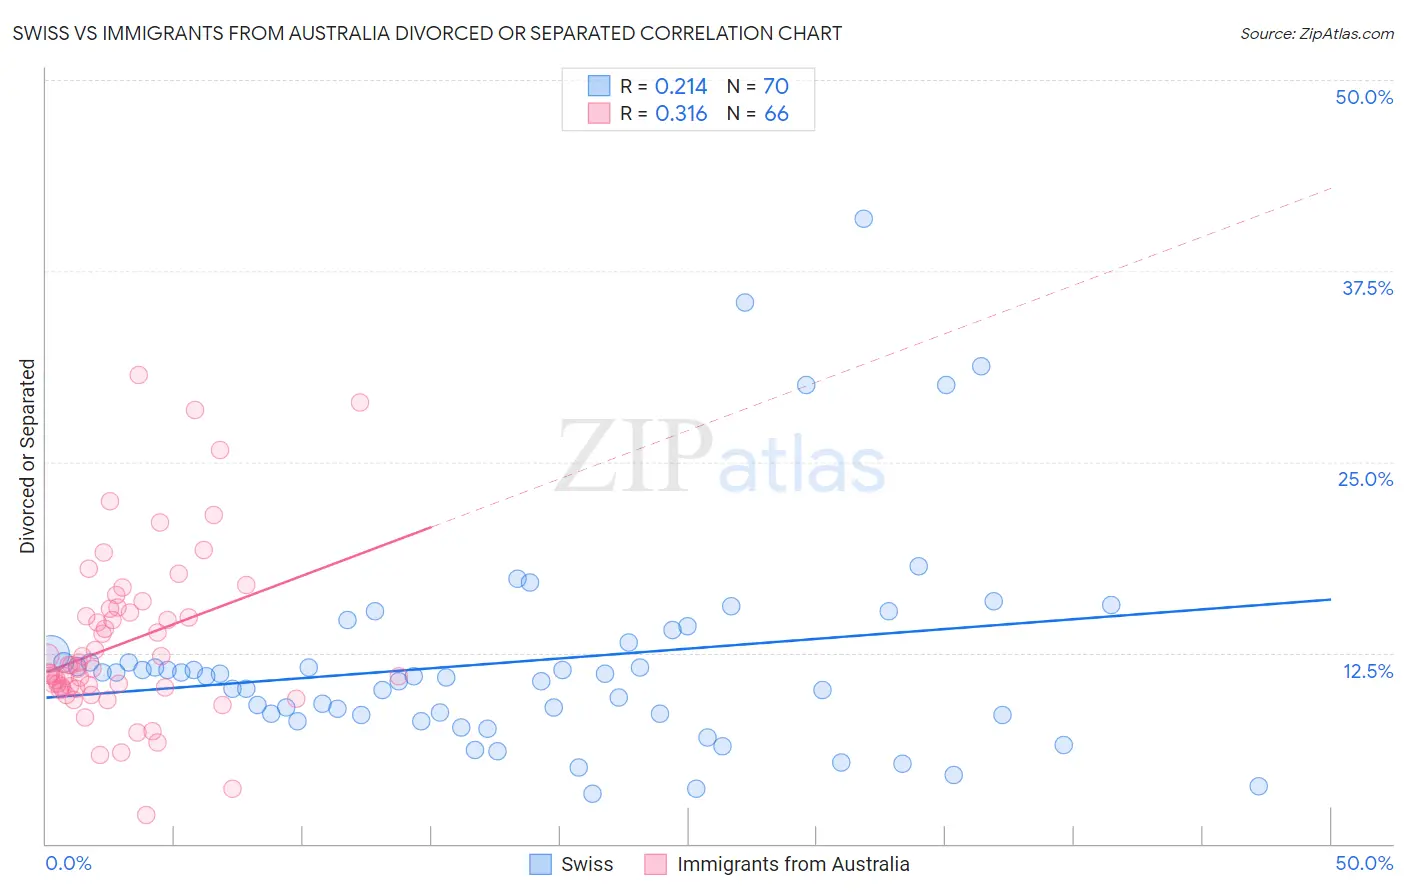
Swiss vs Immigrants from Australia Divorced or Separated Correlation Chart
The statistical analysis conducted on geographies consisting of 464,828,209 people shows a weak positive correlation between the proportion of Swiss and percentage of population currently divorced or separated in the United States with a correlation coefficient (R) of 0.214 and weighted average of 12.0%. Similarly, the statistical analysis conducted on geographies consisting of 227,153,682 people shows a mild positive correlation between the proportion of Immigrants from Australia and percentage of population currently divorced or separated in the United States with a correlation coefficient (R) of 0.316 and weighted average of 11.3%, a difference of 6.5%.
Divorced or Separated Correlation Summary
| Measurement | Swiss | Immigrants from Australia |
| Minimum | 3.3% | 1.9% |
| Maximum | 40.9% | 30.7% |
| Range | 37.6% | 28.8% |
| Mean | 11.9% | 13.2% |
| Median | 11.0% | 11.6% |
| Interquartile 25% (IQ1) | 8.5% | 10.2% |
| Interquartile 75% (IQ3) | 12.4% | 15.4% |
| Interquartile Range (IQR) | 4.0% | 5.2% |
| Standard Deviation (Sample) | 7.0% | 5.6% |
| Standard Deviation (Population) | 6.9% | 5.5% |
Similar Demographics by Divorced or Separated
Demographics Similar to Swiss by Divorced or Separated
In terms of divorced or separated, the demographic groups most similar to Swiss are Navajo (12.0%, a difference of 0.010%), Samoan (12.0%, a difference of 0.020%), Marshallese (12.0%, a difference of 0.040%), German Russian (12.0%, a difference of 0.070%), and Immigrants from Scotland (12.0%, a difference of 0.080%).
| Demographics | Rating | Rank | Divorced or Separated |
| Immigrants | Brazil | 68.8 /100 | #157 | Good 12.0% |
| Icelanders | 66.0 /100 | #158 | Good 12.0% |
| Immigrants | Barbados | 66.0 /100 | #159 | Good 12.0% |
| Immigrants | Scotland | 65.8 /100 | #160 | Good 12.0% |
| Marshallese | 64.6 /100 | #161 | Good 12.0% |
| Samoans | 64.3 /100 | #162 | Good 12.0% |
| Navajo | 63.9 /100 | #163 | Good 12.0% |
| Swiss | 63.6 /100 | #164 | Good 12.0% |
| German Russians | 61.8 /100 | #165 | Good 12.0% |
| Tohono O'odham | 60.4 /100 | #166 | Good 12.0% |
| Ethiopians | 58.5 /100 | #167 | Average 12.0% |
| Serbians | 57.1 /100 | #168 | Average 12.0% |
| Immigrants | Peru | 57.0 /100 | #169 | Average 12.0% |
| Mexican American Indians | 55.8 /100 | #170 | Average 12.0% |
| Costa Ricans | 53.3 /100 | #171 | Average 12.0% |
Demographics Similar to Immigrants from Australia by Divorced or Separated
In terms of divorced or separated, the demographic groups most similar to Immigrants from Australia are Immigrants from Bolivia (11.3%, a difference of 0.11%), Immigrants from Lithuania (11.3%, a difference of 0.23%), Eastern European (11.3%, a difference of 0.34%), Immigrants from Yemen (11.3%, a difference of 0.35%), and Bolivian (11.2%, a difference of 0.40%).
| Demographics | Rating | Rank | Divorced or Separated |
| Turks | 100.0 /100 | #45 | Exceptional 11.2% |
| Laotians | 100.0 /100 | #46 | Exceptional 11.2% |
| Immigrants | Poland | 100.0 /100 | #47 | Exceptional 11.2% |
| Immigrants | Turkey | 100.0 /100 | #48 | Exceptional 11.2% |
| Immigrants | Saudi Arabia | 100.0 /100 | #49 | Exceptional 11.2% |
| Bolivians | 100.0 /100 | #50 | Exceptional 11.2% |
| Immigrants | Bolivia | 100.0 /100 | #51 | Exceptional 11.3% |
| Immigrants | Australia | 99.9 /100 | #52 | Exceptional 11.3% |
| Immigrants | Lithuania | 99.9 /100 | #53 | Exceptional 11.3% |
| Eastern Europeans | 99.9 /100 | #54 | Exceptional 11.3% |
| Immigrants | Yemen | 99.9 /100 | #55 | Exceptional 11.3% |
| Immigrants | Philippines | 99.9 /100 | #56 | Exceptional 11.3% |
| Immigrants | Vietnam | 99.9 /100 | #57 | Exceptional 11.3% |
| Sri Lankans | 99.9 /100 | #58 | Exceptional 11.3% |
| Israelis | 99.9 /100 | #59 | Exceptional 11.3% |