Native/Alaskan vs Immigrants from Bolivia Average Family Size
COMPARE
Native/Alaskan
Immigrants from Bolivia
Average Family Size
Average Family Size Comparison
Natives/Alaskans
Immigrants from Bolivia
3.45
AVERAGE FAMILY SIZE
100.0/ 100
METRIC RATING
24th/ 347
METRIC RANK
3.31
AVERAGE FAMILY SIZE
99.6/ 100
METRIC RATING
88th/ 347
METRIC RANK
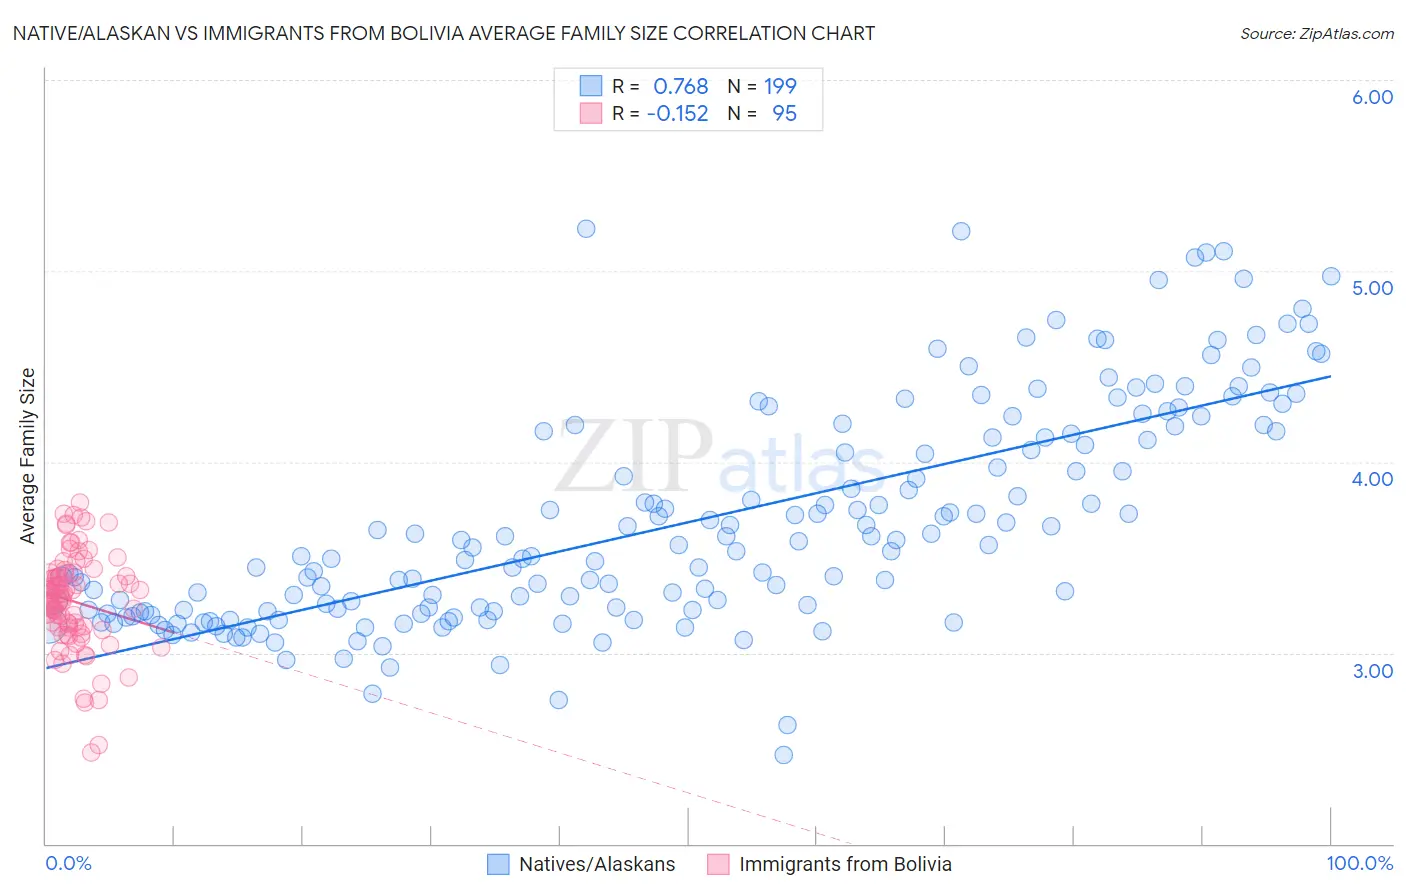
Native/Alaskan vs Immigrants from Bolivia Average Family Size Correlation Chart
The statistical analysis conducted on geographies consisting of 512,654,103 people shows a strong positive correlation between the proportion of Natives/Alaskans and average family size in the United States with a correlation coefficient (R) of 0.768 and weighted average of 3.45. Similarly, the statistical analysis conducted on geographies consisting of 158,712,617 people shows a poor negative correlation between the proportion of Immigrants from Bolivia and average family size in the United States with a correlation coefficient (R) of -0.152 and weighted average of 3.31, a difference of 4.3%.
Average Family Size Correlation Summary
| Measurement | Native/Alaskan | Immigrants from Bolivia |
| Minimum | 2.46 | 2.48 |
| Maximum | 5.22 | 3.79 |
| Range | 2.76 | 1.31 |
| Mean | 3.68 | 3.27 |
| Median | 3.53 | 3.29 |
| Interquartile 25% (IQ1) | 3.22 | 3.13 |
| Interquartile 75% (IQ3) | 4.15 | 3.42 |
| Interquartile Range (IQR) | 0.93 | 0.28 |
| Standard Deviation (Sample) | 0.58 | 0.25 |
| Standard Deviation (Population) | 0.58 | 0.25 |
Similar Demographics by Average Family Size
Demographics Similar to Natives/Alaskans by Average Family Size
In terms of average family size, the demographic groups most similar to Natives/Alaskans are Yakama (3.45, a difference of 0.11%), Immigrants from Fiji (3.45, a difference of 0.12%), Apache (3.46, a difference of 0.41%), Yuman (3.47, a difference of 0.47%), and Native Hawaiian (3.43, a difference of 0.62%).
| Demographics | Rating | Rank | Average Family Size |
| Immigrants | El Salvador | 100.0 /100 | #17 | Exceptional 3.49 |
| Salvadorans | 100.0 /100 | #18 | Exceptional 3.48 |
| Mexicans | 100.0 /100 | #19 | Exceptional 3.48 |
| Cheyenne | 100.0 /100 | #20 | Exceptional 3.47 |
| Yuman | 100.0 /100 | #21 | Exceptional 3.47 |
| Apache | 100.0 /100 | #22 | Exceptional 3.46 |
| Immigrants | Fiji | 100.0 /100 | #23 | Exceptional 3.45 |
| Natives/Alaskans | 100.0 /100 | #24 | Exceptional 3.45 |
| Yakama | 100.0 /100 | #25 | Exceptional 3.45 |
| Native Hawaiians | 100.0 /100 | #26 | Exceptional 3.43 |
| Mexican American Indians | 100.0 /100 | #27 | Exceptional 3.43 |
| Immigrants | Latin America | 100.0 /100 | #28 | Exceptional 3.42 |
| Nepalese | 100.0 /100 | #29 | Exceptional 3.42 |
| Samoans | 100.0 /100 | #30 | Exceptional 3.42 |
| Central Americans | 100.0 /100 | #31 | Exceptional 3.41 |
Demographics Similar to Immigrants from Bolivia by Average Family Size
In terms of average family size, the demographic groups most similar to Immigrants from Bolivia are Malaysian (3.31, a difference of 0.010%), Immigrants from Peru (3.31, a difference of 0.090%), Menominee (3.30, a difference of 0.12%), Jamaican (3.31, a difference of 0.14%), and Afghan (3.31, a difference of 0.16%).
| Demographics | Rating | Rank | Average Family Size |
| Immigrants | Dominica | 99.8 /100 | #81 | Exceptional 3.32 |
| Ecuadorians | 99.8 /100 | #82 | Exceptional 3.32 |
| Immigrants | Afghanistan | 99.8 /100 | #83 | Exceptional 3.32 |
| Immigrants | Nigeria | 99.7 /100 | #84 | Exceptional 3.32 |
| Afghans | 99.7 /100 | #85 | Exceptional 3.31 |
| Jamaicans | 99.7 /100 | #86 | Exceptional 3.31 |
| Immigrants | Peru | 99.7 /100 | #87 | Exceptional 3.31 |
| Immigrants | Bolivia | 99.6 /100 | #88 | Exceptional 3.31 |
| Malaysians | 99.6 /100 | #89 | Exceptional 3.31 |
| Menominee | 99.4 /100 | #90 | Exceptional 3.30 |
| Immigrants | Pakistan | 99.2 /100 | #91 | Exceptional 3.30 |
| Immigrants | Cameroon | 99.2 /100 | #92 | Exceptional 3.30 |
| Peruvians | 99.2 /100 | #93 | Exceptional 3.30 |
| Sierra Leoneans | 99.0 /100 | #94 | Exceptional 3.30 |
| Immigrants | Lebanon | 99.0 /100 | #95 | Exceptional 3.30 |