Choctaw vs Immigrants from Venezuela Divorced or Separated
COMPARE
Choctaw
Immigrants from Venezuela
Divorced or Separated
Divorced or Separated Comparison
Choctaw
Immigrants from Venezuela
14.1%
DIVORCED OR SEPARATED
0.0/ 100
METRIC RATING
338th/ 347
METRIC RANK
13.1%
DIVORCED OR SEPARATED
0.0/ 100
METRIC RATING
302nd/ 347
METRIC RANK
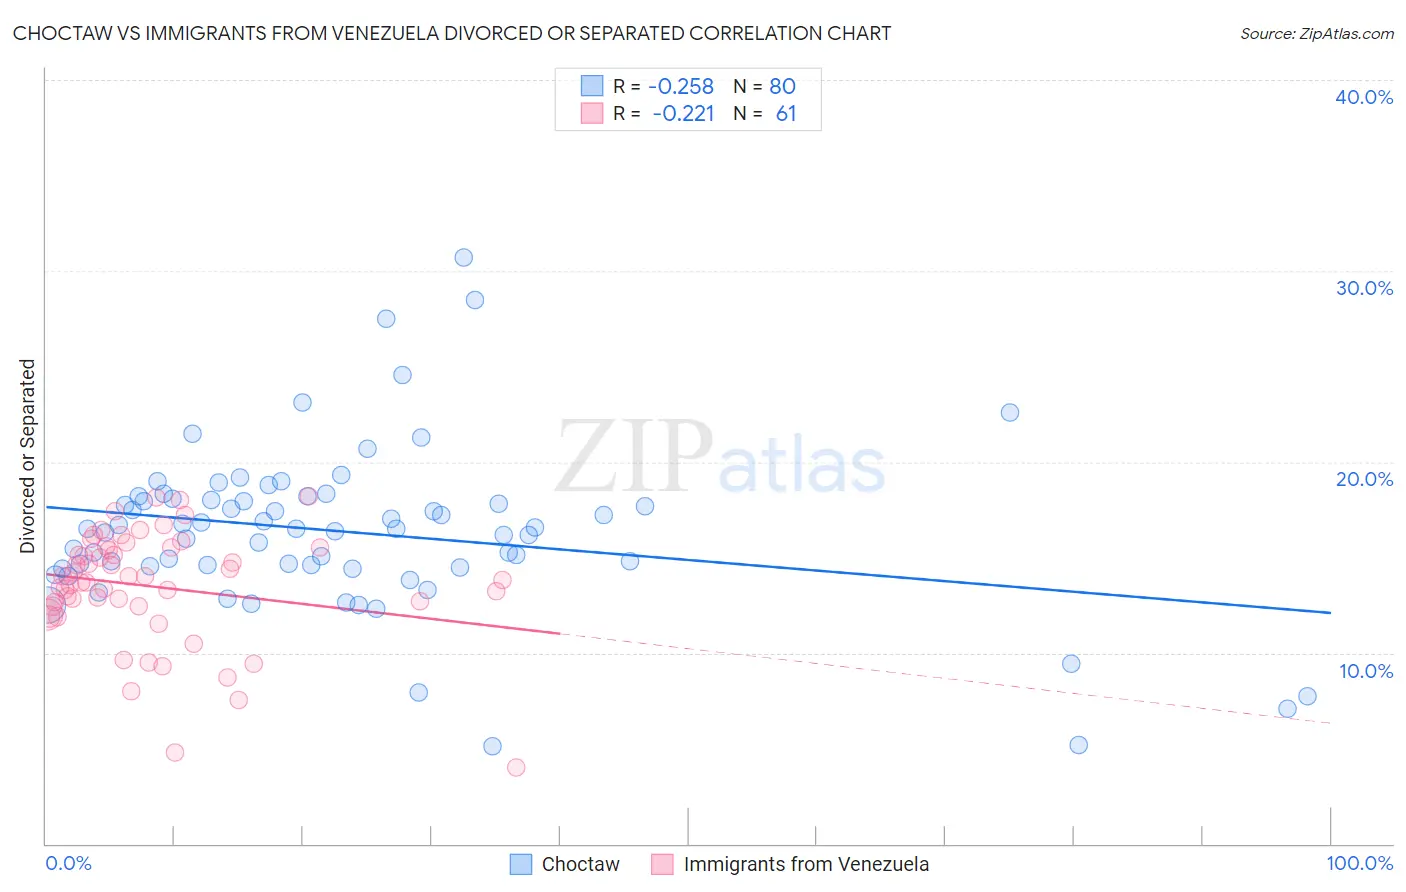
Choctaw vs Immigrants from Venezuela Divorced or Separated Correlation Chart
The statistical analysis conducted on geographies consisting of 269,698,992 people shows a weak negative correlation between the proportion of Choctaw and percentage of population currently divorced or separated in the United States with a correlation coefficient (R) of -0.258 and weighted average of 14.1%. Similarly, the statistical analysis conducted on geographies consisting of 287,802,999 people shows a weak negative correlation between the proportion of Immigrants from Venezuela and percentage of population currently divorced or separated in the United States with a correlation coefficient (R) of -0.221 and weighted average of 13.1%, a difference of 7.5%.
Divorced or Separated Correlation Summary
| Measurement | Choctaw | Immigrants from Venezuela |
| Minimum | 5.1% | 4.0% |
| Maximum | 30.7% | 18.2% |
| Range | 25.6% | 14.2% |
| Mean | 16.3% | 13.5% |
| Median | 16.5% | 13.8% |
| Interquartile 25% (IQ1) | 14.5% | 12.4% |
| Interquartile 75% (IQ3) | 18.0% | 15.5% |
| Interquartile Range (IQR) | 3.5% | 3.1% |
| Standard Deviation (Sample) | 4.3% | 3.0% |
| Standard Deviation (Population) | 4.3% | 3.0% |
Similar Demographics by Divorced or Separated
Demographics Similar to Choctaw by Divorced or Separated
In terms of divorced or separated, the demographic groups most similar to Choctaw are Crow (14.1%, a difference of 0.31%), Colville (14.2%, a difference of 0.53%), Chickasaw (14.2%, a difference of 0.57%), Shoshone (14.0%, a difference of 0.60%), and Bahamian (14.2%, a difference of 0.77%).
| Demographics | Rating | Rank | Divorced or Separated |
| Blacks/African Americans | 0.0 /100 | #331 | Tragic 13.6% |
| Cherokee | 0.0 /100 | #332 | Tragic 13.7% |
| Puerto Ricans | 0.0 /100 | #333 | Tragic 13.9% |
| Immigrants | Bahamas | 0.0 /100 | #334 | Tragic 13.9% |
| Dutch West Indians | 0.0 /100 | #335 | Tragic 14.0% |
| Shoshone | 0.0 /100 | #336 | Tragic 14.0% |
| Crow | 0.0 /100 | #337 | Tragic 14.1% |
| Choctaw | 0.0 /100 | #338 | Tragic 14.1% |
| Colville | 0.0 /100 | #339 | Tragic 14.2% |
| Chickasaw | 0.0 /100 | #340 | Tragic 14.2% |
| Bahamians | 0.0 /100 | #341 | Tragic 14.2% |
| Seminole | 0.0 /100 | #342 | Tragic 14.3% |
| Creek | 0.0 /100 | #343 | Tragic 14.4% |
| Cubans | 0.0 /100 | #344 | Tragic 14.5% |
| Kiowa | 0.0 /100 | #345 | Tragic 14.5% |
Demographics Similar to Immigrants from Venezuela by Divorced or Separated
In terms of divorced or separated, the demographic groups most similar to Immigrants from Venezuela are Cape Verdean (13.1%, a difference of 0.020%), Alaskan Athabascan (13.1%, a difference of 0.10%), Hopi (13.2%, a difference of 0.15%), Chippewa (13.2%, a difference of 0.20%), and Immigrants from Cabo Verde (13.1%, a difference of 0.31%).
| Demographics | Rating | Rank | Divorced or Separated |
| Celtics | 0.0 /100 | #295 | Tragic 13.0% |
| Nicaraguans | 0.0 /100 | #296 | Tragic 13.0% |
| Natives/Alaskans | 0.0 /100 | #297 | Tragic 13.0% |
| Venezuelans | 0.0 /100 | #298 | Tragic 13.0% |
| Immigrants | Jamaica | 0.0 /100 | #299 | Tragic 13.0% |
| Immigrants | Cabo Verde | 0.0 /100 | #300 | Tragic 13.1% |
| Alaskan Athabascans | 0.0 /100 | #301 | Tragic 13.1% |
| Immigrants | Venezuela | 0.0 /100 | #302 | Tragic 13.1% |
| Cape Verdeans | 0.0 /100 | #303 | Tragic 13.1% |
| Hopi | 0.0 /100 | #304 | Tragic 13.2% |
| Chippewa | 0.0 /100 | #305 | Tragic 13.2% |
| Tlingit-Haida | 0.0 /100 | #306 | Tragic 13.2% |
| French American Indians | 0.0 /100 | #307 | Tragic 13.2% |
| Ottawa | 0.0 /100 | #308 | Tragic 13.2% |
| Americans | 0.0 /100 | #309 | Tragic 13.2% |