Immigrants from Hong Kong vs Immigrants from Venezuela Divorced or Separated
COMPARE
Immigrants from Hong Kong
Immigrants from Venezuela
Divorced or Separated
Divorced or Separated Comparison
Immigrants from Hong Kong
Immigrants from Venezuela
10.0%
DIVORCED OR SEPARATED
100.0/ 100
METRIC RATING
3rd/ 347
METRIC RANK
13.1%
DIVORCED OR SEPARATED
0.0/ 100
METRIC RATING
302nd/ 347
METRIC RANK
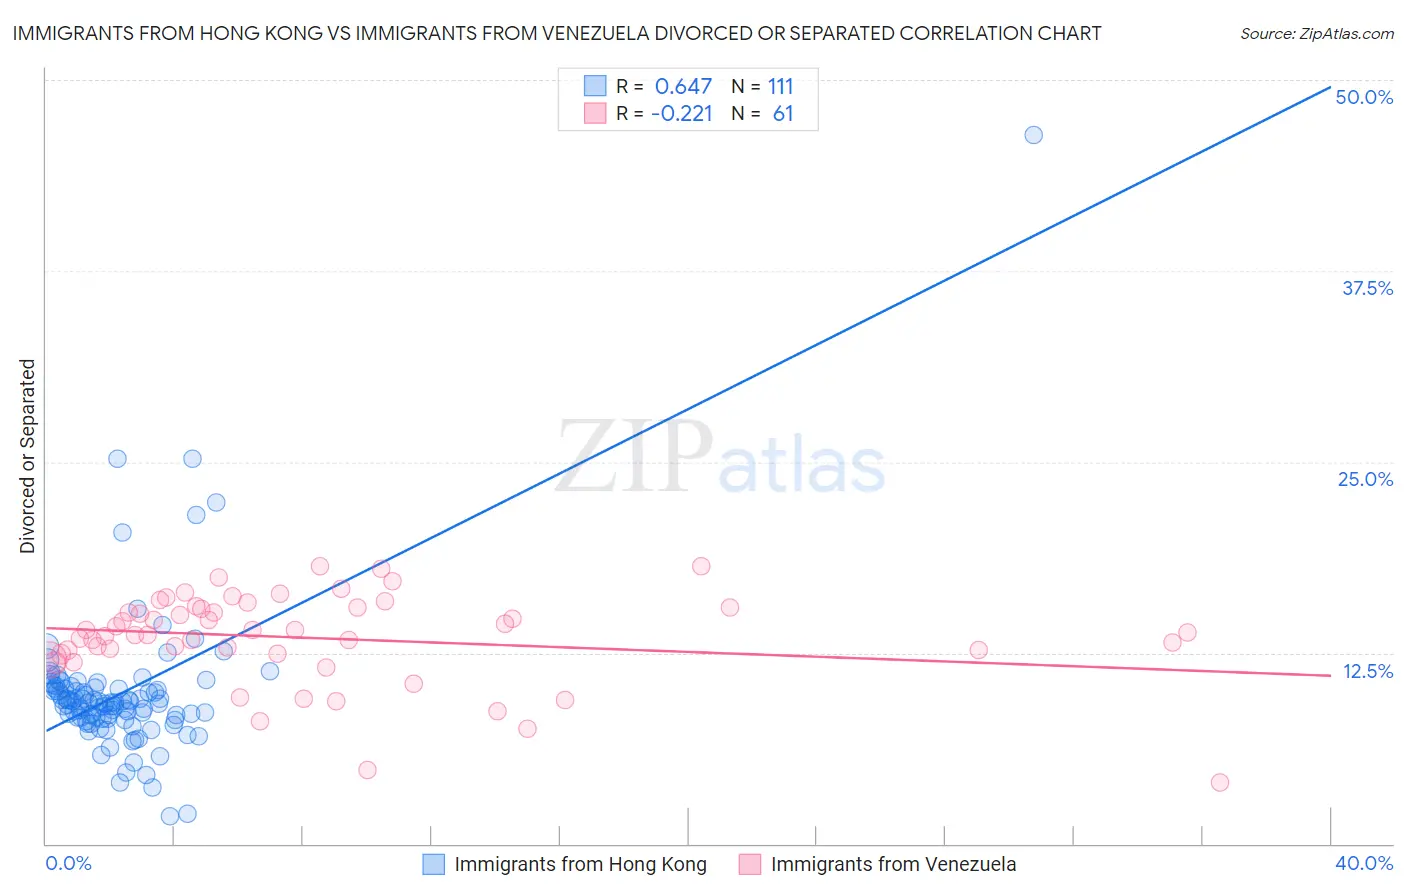
Immigrants from Hong Kong vs Immigrants from Venezuela Divorced or Separated Correlation Chart
The statistical analysis conducted on geographies consisting of 253,935,113 people shows a significant positive correlation between the proportion of Immigrants from Hong Kong and percentage of population currently divorced or separated in the United States with a correlation coefficient (R) of 0.647 and weighted average of 10.0%. Similarly, the statistical analysis conducted on geographies consisting of 287,802,999 people shows a weak negative correlation between the proportion of Immigrants from Venezuela and percentage of population currently divorced or separated in the United States with a correlation coefficient (R) of -0.221 and weighted average of 13.1%, a difference of 31.8%.
Divorced or Separated Correlation Summary
| Measurement | Immigrants from Hong Kong | Immigrants from Venezuela |
| Minimum | 1.8% | 4.0% |
| Maximum | 46.4% | 18.2% |
| Range | 44.6% | 14.2% |
| Mean | 9.9% | 13.5% |
| Median | 9.2% | 13.8% |
| Interquartile 25% (IQ1) | 8.2% | 12.4% |
| Interquartile 75% (IQ3) | 10.2% | 15.5% |
| Interquartile Range (IQR) | 2.0% | 3.1% |
| Standard Deviation (Sample) | 5.0% | 3.0% |
| Standard Deviation (Population) | 5.0% | 3.0% |
Similar Demographics by Divorced or Separated
Demographics Similar to Immigrants from Hong Kong by Divorced or Separated
In terms of divorced or separated, the demographic groups most similar to Immigrants from Hong Kong are Filipino (9.9%, a difference of 0.56%), Immigrants from China (10.0%, a difference of 0.72%), Immigrants from India (10.1%, a difference of 0.96%), Immigrants from Taiwan (9.8%, a difference of 1.6%), and Indian (Asian) (10.2%, a difference of 2.3%).
| Demographics | Rating | Rank | Divorced or Separated |
| Immigrants | Taiwan | 100.0 /100 | #1 | Exceptional 9.8% |
| Filipinos | 100.0 /100 | #2 | Exceptional 9.9% |
| Immigrants | Hong Kong | 100.0 /100 | #3 | Exceptional 10.0% |
| Immigrants | China | 100.0 /100 | #4 | Exceptional 10.0% |
| Immigrants | India | 100.0 /100 | #5 | Exceptional 10.1% |
| Indians (Asian) | 100.0 /100 | #6 | Exceptional 10.2% |
| Thais | 100.0 /100 | #7 | Exceptional 10.2% |
| Immigrants | Eastern Asia | 100.0 /100 | #8 | Exceptional 10.2% |
| Yup'ik | 100.0 /100 | #9 | Exceptional 10.3% |
| Immigrants | Singapore | 100.0 /100 | #10 | Exceptional 10.3% |
| Immigrants | South Central Asia | 100.0 /100 | #11 | Exceptional 10.4% |
| Okinawans | 100.0 /100 | #12 | Exceptional 10.5% |
| Cypriots | 100.0 /100 | #13 | Exceptional 10.5% |
| Assyrians/Chaldeans/Syriacs | 100.0 /100 | #14 | Exceptional 10.6% |
| Immigrants | Armenia | 100.0 /100 | #15 | Exceptional 10.6% |
Demographics Similar to Immigrants from Venezuela by Divorced or Separated
In terms of divorced or separated, the demographic groups most similar to Immigrants from Venezuela are Cape Verdean (13.1%, a difference of 0.020%), Alaskan Athabascan (13.1%, a difference of 0.10%), Hopi (13.2%, a difference of 0.15%), Chippewa (13.2%, a difference of 0.20%), and Immigrants from Cabo Verde (13.1%, a difference of 0.31%).
| Demographics | Rating | Rank | Divorced or Separated |
| Celtics | 0.0 /100 | #295 | Tragic 13.0% |
| Nicaraguans | 0.0 /100 | #296 | Tragic 13.0% |
| Natives/Alaskans | 0.0 /100 | #297 | Tragic 13.0% |
| Venezuelans | 0.0 /100 | #298 | Tragic 13.0% |
| Immigrants | Jamaica | 0.0 /100 | #299 | Tragic 13.0% |
| Immigrants | Cabo Verde | 0.0 /100 | #300 | Tragic 13.1% |
| Alaskan Athabascans | 0.0 /100 | #301 | Tragic 13.1% |
| Immigrants | Venezuela | 0.0 /100 | #302 | Tragic 13.1% |
| Cape Verdeans | 0.0 /100 | #303 | Tragic 13.1% |
| Hopi | 0.0 /100 | #304 | Tragic 13.2% |
| Chippewa | 0.0 /100 | #305 | Tragic 13.2% |
| Tlingit-Haida | 0.0 /100 | #306 | Tragic 13.2% |
| French American Indians | 0.0 /100 | #307 | Tragic 13.2% |
| Ottawa | 0.0 /100 | #308 | Tragic 13.2% |
| Americans | 0.0 /100 | #309 | Tragic 13.2% |