Hopi vs Immigrants from Peru Divorced or Separated
COMPARE
Hopi
Immigrants from Peru
Divorced or Separated
Divorced or Separated Comparison
Hopi
Immigrants from Peru
13.2%
DIVORCED OR SEPARATED
0.0/ 100
METRIC RATING
304th/ 347
METRIC RANK
12.0%
DIVORCED OR SEPARATED
57.0/ 100
METRIC RATING
169th/ 347
METRIC RANK
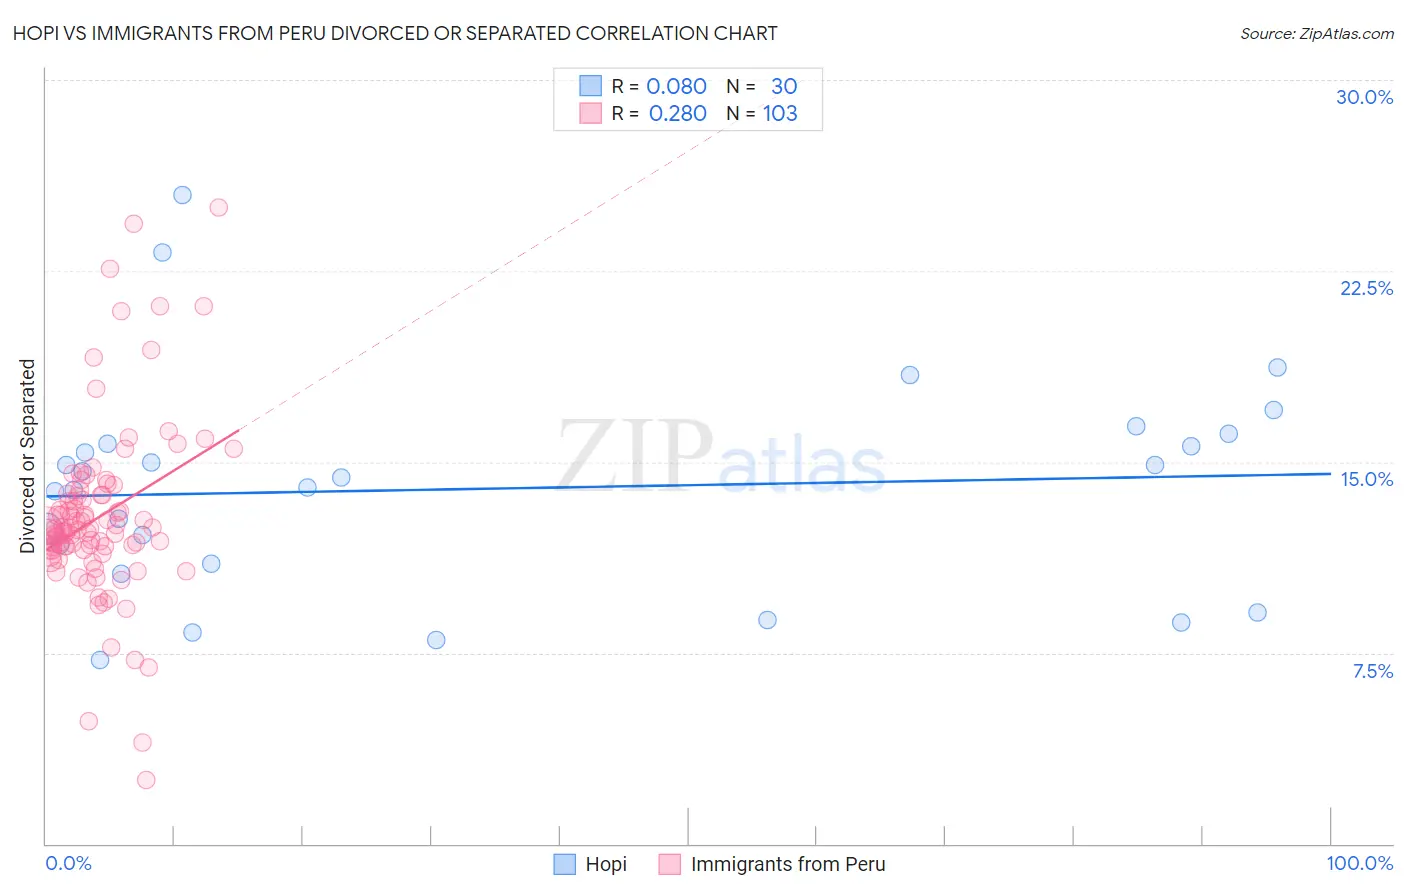
Hopi vs Immigrants from Peru Divorced or Separated Correlation Chart
The statistical analysis conducted on geographies consisting of 74,740,168 people shows a slight positive correlation between the proportion of Hopi and percentage of population currently divorced or separated in the United States with a correlation coefficient (R) of 0.080 and weighted average of 13.2%. Similarly, the statistical analysis conducted on geographies consisting of 328,793,574 people shows a weak positive correlation between the proportion of Immigrants from Peru and percentage of population currently divorced or separated in the United States with a correlation coefficient (R) of 0.280 and weighted average of 12.0%, a difference of 9.4%.
Divorced or Separated Correlation Summary
| Measurement | Hopi | Immigrants from Peru |
| Minimum | 7.2% | 2.5% |
| Maximum | 25.5% | 25.0% |
| Range | 18.3% | 22.5% |
| Mean | 13.9% | 12.8% |
| Median | 14.2% | 12.4% |
| Interquartile 25% (IQ1) | 11.0% | 11.6% |
| Interquartile 75% (IQ3) | 15.7% | 13.7% |
| Interquartile Range (IQR) | 4.7% | 2.1% |
| Standard Deviation (Sample) | 4.2% | 3.5% |
| Standard Deviation (Population) | 4.1% | 3.5% |
Similar Demographics by Divorced or Separated
Demographics Similar to Hopi by Divorced or Separated
In terms of divorced or separated, the demographic groups most similar to Hopi are Chippewa (13.2%, a difference of 0.050%), Cape Verdean (13.1%, a difference of 0.13%), Immigrants from Venezuela (13.1%, a difference of 0.15%), Tlingit-Haida (13.2%, a difference of 0.22%), and Alaskan Athabascan (13.1%, a difference of 0.25%).
| Demographics | Rating | Rank | Divorced or Separated |
| Natives/Alaskans | 0.0 /100 | #297 | Tragic 13.0% |
| Venezuelans | 0.0 /100 | #298 | Tragic 13.0% |
| Immigrants | Jamaica | 0.0 /100 | #299 | Tragic 13.0% |
| Immigrants | Cabo Verde | 0.0 /100 | #300 | Tragic 13.1% |
| Alaskan Athabascans | 0.0 /100 | #301 | Tragic 13.1% |
| Immigrants | Venezuela | 0.0 /100 | #302 | Tragic 13.1% |
| Cape Verdeans | 0.0 /100 | #303 | Tragic 13.1% |
| Hopi | 0.0 /100 | #304 | Tragic 13.2% |
| Chippewa | 0.0 /100 | #305 | Tragic 13.2% |
| Tlingit-Haida | 0.0 /100 | #306 | Tragic 13.2% |
| French American Indians | 0.0 /100 | #307 | Tragic 13.2% |
| Ottawa | 0.0 /100 | #308 | Tragic 13.2% |
| Americans | 0.0 /100 | #309 | Tragic 13.2% |
| Africans | 0.0 /100 | #310 | Tragic 13.2% |
| Sioux | 0.0 /100 | #311 | Tragic 13.2% |
Demographics Similar to Immigrants from Peru by Divorced or Separated
In terms of divorced or separated, the demographic groups most similar to Immigrants from Peru are Serbian (12.0%, a difference of 0.0%), Mexican American Indian (12.0%, a difference of 0.040%), Ethiopian (12.0%, a difference of 0.050%), Tohono O'odham (12.0%, a difference of 0.12%), and Costa Rican (12.0%, a difference of 0.13%).
| Demographics | Rating | Rank | Divorced or Separated |
| Samoans | 64.3 /100 | #162 | Good 12.0% |
| Navajo | 63.9 /100 | #163 | Good 12.0% |
| Swiss | 63.6 /100 | #164 | Good 12.0% |
| German Russians | 61.8 /100 | #165 | Good 12.0% |
| Tohono O'odham | 60.4 /100 | #166 | Good 12.0% |
| Ethiopians | 58.5 /100 | #167 | Average 12.0% |
| Serbians | 57.1 /100 | #168 | Average 12.0% |
| Immigrants | Peru | 57.0 /100 | #169 | Average 12.0% |
| Mexican American Indians | 55.8 /100 | #170 | Average 12.0% |
| Costa Ricans | 53.3 /100 | #171 | Average 12.0% |
| Immigrants | Mexico | 53.2 /100 | #172 | Average 12.0% |
| Immigrants | Moldova | 50.4 /100 | #173 | Average 12.1% |
| Hawaiians | 50.0 /100 | #174 | Average 12.1% |
| Immigrants | Sierra Leone | 50.0 /100 | #175 | Average 12.1% |
| Pennsylvania Germans | 48.9 /100 | #176 | Average 12.1% |