Crow vs Chilean Single Mother Households
COMPARE
Crow
Chilean
Single Mother Households
Single Mother Households Comparison
Crow
Chileans
7.4%
SINGLE MOTHER HOUSEHOLDS
0.1/ 100
METRIC RATING
265th/ 347
METRIC RANK
6.1%
SINGLE MOTHER HOUSEHOLDS
74.2/ 100
METRIC RATING
157th/ 347
METRIC RANK
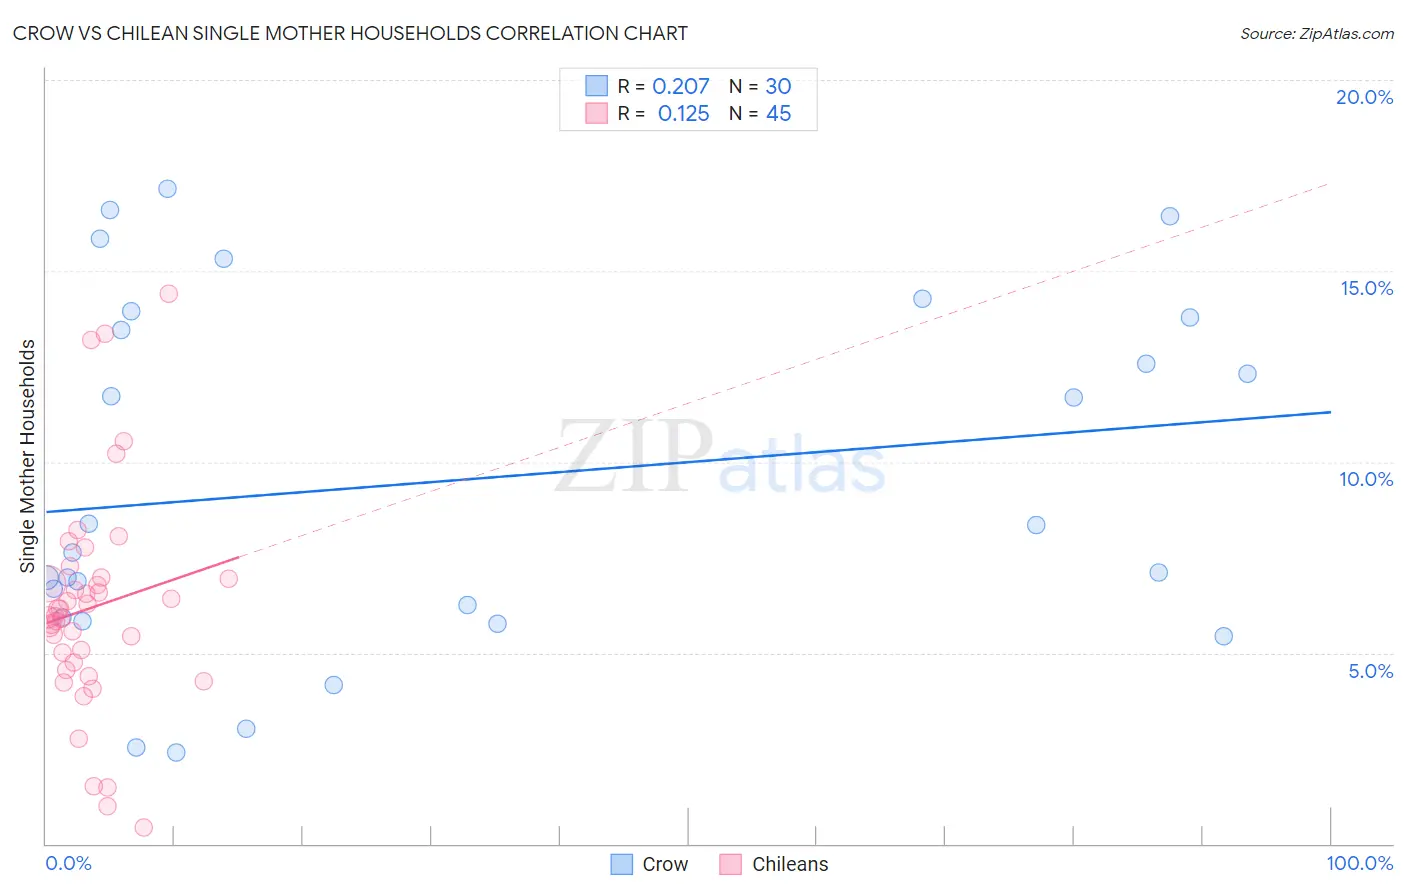
Crow vs Chilean Single Mother Households Correlation Chart
The statistical analysis conducted on geographies consisting of 59,176,023 people shows a weak positive correlation between the proportion of Crow and percentage of single mother households in the United States with a correlation coefficient (R) of 0.207 and weighted average of 7.4%. Similarly, the statistical analysis conducted on geographies consisting of 256,326,378 people shows a poor positive correlation between the proportion of Chileans and percentage of single mother households in the United States with a correlation coefficient (R) of 0.125 and weighted average of 6.1%, a difference of 21.5%.
Single Mother Households Correlation Summary
| Measurement | Crow | Chilean |
| Minimum | 2.4% | 0.42% |
| Maximum | 17.1% | 14.4% |
| Range | 14.8% | 14.0% |
| Mean | 9.5% | 6.2% |
| Median | 8.0% | 6.0% |
| Interquartile 25% (IQ1) | 5.9% | 4.6% |
| Interquartile 75% (IQ3) | 13.8% | 7.0% |
| Interquartile Range (IQR) | 7.8% | 2.3% |
| Standard Deviation (Sample) | 4.6% | 2.9% |
| Standard Deviation (Population) | 4.5% | 2.9% |
Similar Demographics by Single Mother Households
Demographics Similar to Crow by Single Mother Households
In terms of single mother households, the demographic groups most similar to Crow are Nepalese (7.5%, a difference of 0.090%), Yaqui (7.4%, a difference of 0.18%), Immigrants from Nicaragua (7.4%, a difference of 0.25%), Immigrants from Somalia (7.4%, a difference of 0.40%), and Blackfeet (7.5%, a difference of 0.43%).
| Demographics | Rating | Rank | Single Mother Households |
| Pueblo | 0.2 /100 | #258 | Tragic 7.4% |
| Immigrants | Yemen | 0.2 /100 | #259 | Tragic 7.4% |
| Immigrants | Zaire | 0.2 /100 | #260 | Tragic 7.4% |
| Japanese | 0.2 /100 | #261 | Tragic 7.4% |
| Immigrants | Somalia | 0.2 /100 | #262 | Tragic 7.4% |
| Immigrants | Nicaragua | 0.2 /100 | #263 | Tragic 7.4% |
| Yaqui | 0.1 /100 | #264 | Tragic 7.4% |
| Crow | 0.1 /100 | #265 | Tragic 7.4% |
| Nepalese | 0.1 /100 | #266 | Tragic 7.5% |
| Blackfeet | 0.1 /100 | #267 | Tragic 7.5% |
| Indonesians | 0.1 /100 | #268 | Tragic 7.5% |
| Somalis | 0.1 /100 | #269 | Tragic 7.5% |
| Immigrants | Cuba | 0.1 /100 | #270 | Tragic 7.5% |
| Salvadorans | 0.1 /100 | #271 | Tragic 7.5% |
| Immigrants | Azores | 0.1 /100 | #272 | Tragic 7.5% |
Demographics Similar to Chileans by Single Mother Households
In terms of single mother households, the demographic groups most similar to Chileans are Native Hawaiian (6.1%, a difference of 0.11%), Celtic (6.1%, a difference of 0.13%), Yugoslavian (6.1%, a difference of 0.17%), Iraqi (6.1%, a difference of 0.19%), and Immigrants from Germany (6.1%, a difference of 0.27%).
| Demographics | Rating | Rank | Single Mother Households |
| Zimbabweans | 80.7 /100 | #150 | Excellent 6.1% |
| Immigrants | Southern Europe | 80.5 /100 | #151 | Excellent 6.1% |
| Pakistanis | 79.2 /100 | #152 | Good 6.1% |
| Immigrants | Brazil | 78.9 /100 | #153 | Good 6.1% |
| Immigrants | Philippines | 78.5 /100 | #154 | Good 6.1% |
| Whites/Caucasians | 76.5 /100 | #155 | Good 6.1% |
| Native Hawaiians | 75.0 /100 | #156 | Good 6.1% |
| Chileans | 74.2 /100 | #157 | Good 6.1% |
| Celtics | 73.3 /100 | #158 | Good 6.1% |
| Yugoslavians | 73.1 /100 | #159 | Good 6.1% |
| Iraqis | 73.0 /100 | #160 | Good 6.1% |
| Immigrants | Germany | 72.4 /100 | #161 | Good 6.1% |
| Immigrants | Zimbabwe | 69.9 /100 | #162 | Good 6.2% |
| Alsatians | 68.7 /100 | #163 | Good 6.2% |
| Immigrants | Northern Africa | 68.0 /100 | #164 | Good 6.2% |