Crow vs Immigrants from Western Asia Single Mother Households
COMPARE
Crow
Immigrants from Western Asia
Single Mother Households
Single Mother Households Comparison
Crow
Immigrants from Western Asia
7.4%
SINGLE MOTHER HOUSEHOLDS
0.1/ 100
METRIC RATING
265th/ 347
METRIC RANK
5.7%
SINGLE MOTHER HOUSEHOLDS
96.7/ 100
METRIC RATING
92nd/ 347
METRIC RANK
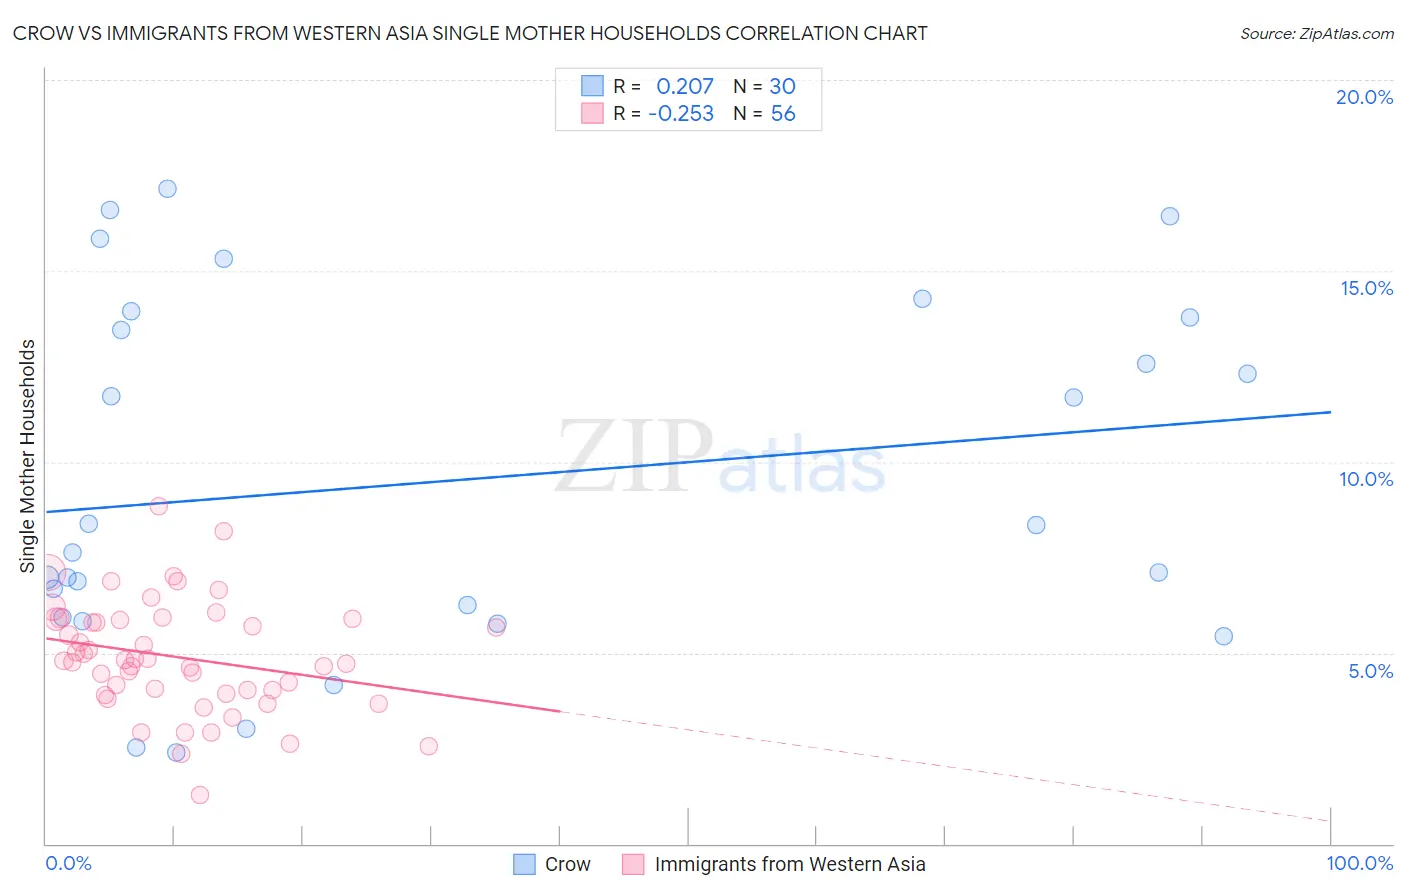
Crow vs Immigrants from Western Asia Single Mother Households Correlation Chart
The statistical analysis conducted on geographies consisting of 59,176,023 people shows a weak positive correlation between the proportion of Crow and percentage of single mother households in the United States with a correlation coefficient (R) of 0.207 and weighted average of 7.4%. Similarly, the statistical analysis conducted on geographies consisting of 403,187,700 people shows a weak negative correlation between the proportion of Immigrants from Western Asia and percentage of single mother households in the United States with a correlation coefficient (R) of -0.253 and weighted average of 5.7%, a difference of 30.1%.
Single Mother Households Correlation Summary
| Measurement | Crow | Immigrants from Western Asia |
| Minimum | 2.4% | 1.3% |
| Maximum | 17.1% | 8.8% |
| Range | 14.8% | 7.6% |
| Mean | 9.5% | 4.9% |
| Median | 8.0% | 4.8% |
| Interquartile 25% (IQ1) | 5.9% | 4.0% |
| Interquartile 75% (IQ3) | 13.8% | 5.9% |
| Interquartile Range (IQR) | 7.8% | 1.9% |
| Standard Deviation (Sample) | 4.6% | 1.5% |
| Standard Deviation (Population) | 4.5% | 1.4% |
Similar Demographics by Single Mother Households
Demographics Similar to Crow by Single Mother Households
In terms of single mother households, the demographic groups most similar to Crow are Nepalese (7.5%, a difference of 0.090%), Yaqui (7.4%, a difference of 0.18%), Immigrants from Nicaragua (7.4%, a difference of 0.25%), Immigrants from Somalia (7.4%, a difference of 0.40%), and Blackfeet (7.5%, a difference of 0.43%).
| Demographics | Rating | Rank | Single Mother Households |
| Pueblo | 0.2 /100 | #258 | Tragic 7.4% |
| Immigrants | Yemen | 0.2 /100 | #259 | Tragic 7.4% |
| Immigrants | Zaire | 0.2 /100 | #260 | Tragic 7.4% |
| Japanese | 0.2 /100 | #261 | Tragic 7.4% |
| Immigrants | Somalia | 0.2 /100 | #262 | Tragic 7.4% |
| Immigrants | Nicaragua | 0.2 /100 | #263 | Tragic 7.4% |
| Yaqui | 0.1 /100 | #264 | Tragic 7.4% |
| Crow | 0.1 /100 | #265 | Tragic 7.4% |
| Nepalese | 0.1 /100 | #266 | Tragic 7.5% |
| Blackfeet | 0.1 /100 | #267 | Tragic 7.5% |
| Indonesians | 0.1 /100 | #268 | Tragic 7.5% |
| Somalis | 0.1 /100 | #269 | Tragic 7.5% |
| Immigrants | Cuba | 0.1 /100 | #270 | Tragic 7.5% |
| Salvadorans | 0.1 /100 | #271 | Tragic 7.5% |
| Immigrants | Azores | 0.1 /100 | #272 | Tragic 7.5% |
Demographics Similar to Immigrants from Western Asia by Single Mother Households
In terms of single mother households, the demographic groups most similar to Immigrants from Western Asia are Serbian (5.7%, a difference of 0.010%), Basque (5.7%, a difference of 0.060%), Slovak (5.7%, a difference of 0.12%), European (5.7%, a difference of 0.23%), and Austrian (5.7%, a difference of 0.27%).
| Demographics | Rating | Rank | Single Mother Households |
| Hungarians | 97.6 /100 | #85 | Exceptional 5.7% |
| Finns | 97.6 /100 | #86 | Exceptional 5.7% |
| Immigrants | Turkey | 97.5 /100 | #87 | Exceptional 5.7% |
| Israelis | 97.4 /100 | #88 | Exceptional 5.7% |
| Ukrainians | 97.2 /100 | #89 | Exceptional 5.7% |
| Immigrants | Indonesia | 97.2 /100 | #90 | Exceptional 5.7% |
| Europeans | 97.0 /100 | #91 | Exceptional 5.7% |
| Immigrants | Western Asia | 96.7 /100 | #92 | Exceptional 5.7% |
| Serbians | 96.7 /100 | #93 | Exceptional 5.7% |
| Basques | 96.7 /100 | #94 | Exceptional 5.7% |
| Slovaks | 96.6 /100 | #95 | Exceptional 5.7% |
| Austrians | 96.4 /100 | #96 | Exceptional 5.7% |
| Tlingit-Haida | 96.4 /100 | #97 | Exceptional 5.7% |
| Immigrants | South Africa | 96.3 /100 | #98 | Exceptional 5.7% |
| Immigrants | Poland | 96.3 /100 | #99 | Exceptional 5.8% |