Crow vs Immigrants from Canada Single Mother Households
COMPARE
Crow
Immigrants from Canada
Single Mother Households
Single Mother Households Comparison
Crow
Immigrants from Canada
7.4%
SINGLE MOTHER HOUSEHOLDS
0.1/ 100
METRIC RATING
265th/ 347
METRIC RANK
5.6%
SINGLE MOTHER HOUSEHOLDS
98.5/ 100
METRIC RATING
66th/ 347
METRIC RANK
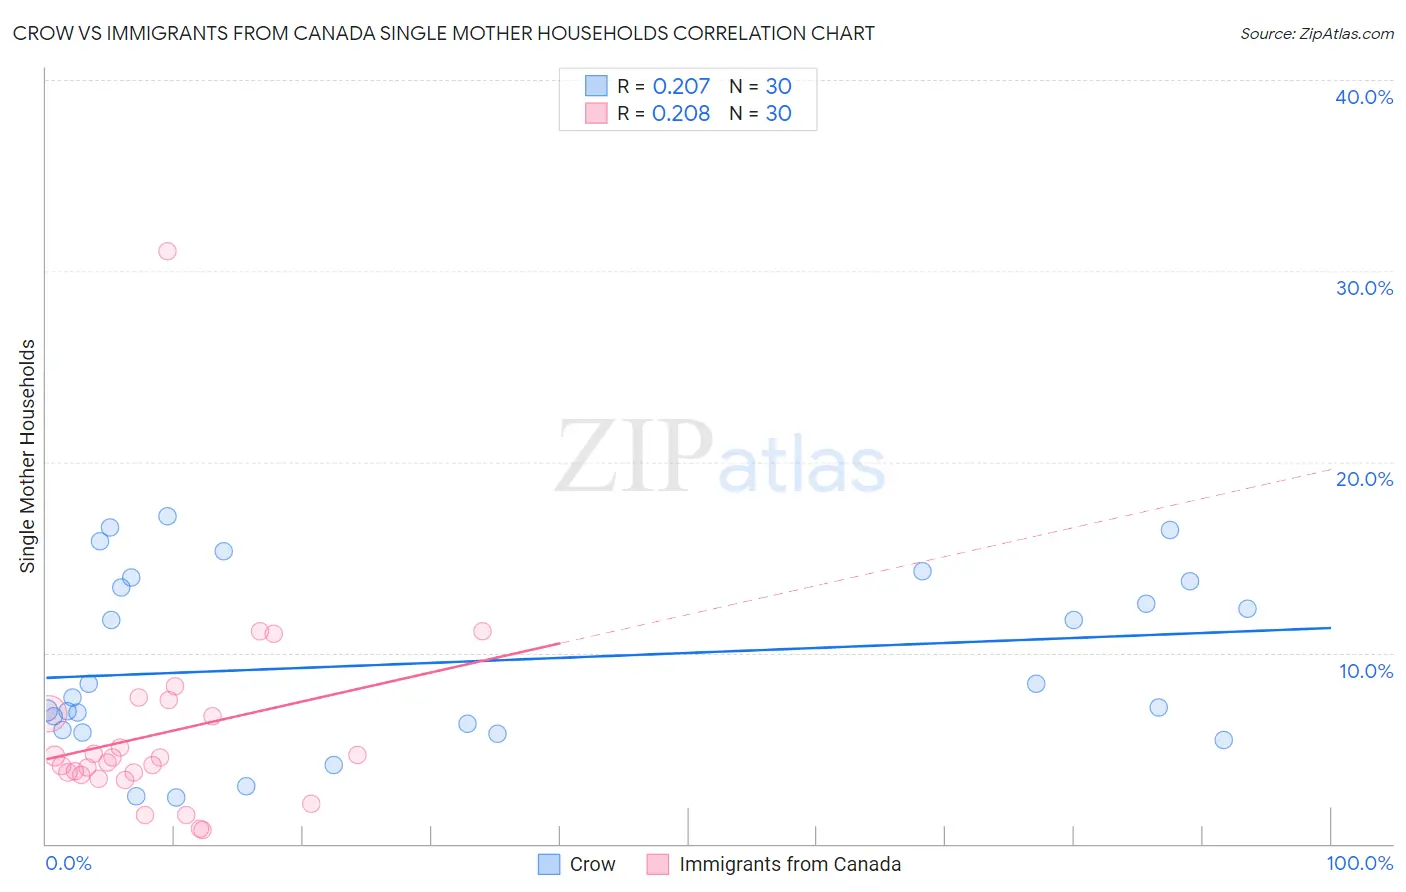
Crow vs Immigrants from Canada Single Mother Households Correlation Chart
The statistical analysis conducted on geographies consisting of 59,176,023 people shows a weak positive correlation between the proportion of Crow and percentage of single mother households in the United States with a correlation coefficient (R) of 0.207 and weighted average of 7.4%. Similarly, the statistical analysis conducted on geographies consisting of 457,332,787 people shows a weak positive correlation between the proportion of Immigrants from Canada and percentage of single mother households in the United States with a correlation coefficient (R) of 0.208 and weighted average of 5.6%, a difference of 33.4%.
Single Mother Households Correlation Summary
| Measurement | Crow | Immigrants from Canada |
| Minimum | 2.4% | 0.70% |
| Maximum | 17.1% | 31.0% |
| Range | 14.8% | 30.3% |
| Mean | 9.5% | 5.8% |
| Median | 8.0% | 4.4% |
| Interquartile 25% (IQ1) | 5.9% | 3.6% |
| Interquartile 75% (IQ3) | 13.8% | 6.8% |
| Interquartile Range (IQR) | 7.8% | 3.2% |
| Standard Deviation (Sample) | 4.6% | 5.5% |
| Standard Deviation (Population) | 4.5% | 5.4% |
Similar Demographics by Single Mother Households
Demographics Similar to Crow by Single Mother Households
In terms of single mother households, the demographic groups most similar to Crow are Nepalese (7.5%, a difference of 0.090%), Yaqui (7.4%, a difference of 0.18%), Immigrants from Nicaragua (7.4%, a difference of 0.25%), Immigrants from Somalia (7.4%, a difference of 0.40%), and Blackfeet (7.5%, a difference of 0.43%).
| Demographics | Rating | Rank | Single Mother Households |
| Pueblo | 0.2 /100 | #258 | Tragic 7.4% |
| Immigrants | Yemen | 0.2 /100 | #259 | Tragic 7.4% |
| Immigrants | Zaire | 0.2 /100 | #260 | Tragic 7.4% |
| Japanese | 0.2 /100 | #261 | Tragic 7.4% |
| Immigrants | Somalia | 0.2 /100 | #262 | Tragic 7.4% |
| Immigrants | Nicaragua | 0.2 /100 | #263 | Tragic 7.4% |
| Yaqui | 0.1 /100 | #264 | Tragic 7.4% |
| Crow | 0.1 /100 | #265 | Tragic 7.4% |
| Nepalese | 0.1 /100 | #266 | Tragic 7.5% |
| Blackfeet | 0.1 /100 | #267 | Tragic 7.5% |
| Indonesians | 0.1 /100 | #268 | Tragic 7.5% |
| Somalis | 0.1 /100 | #269 | Tragic 7.5% |
| Immigrants | Cuba | 0.1 /100 | #270 | Tragic 7.5% |
| Salvadorans | 0.1 /100 | #271 | Tragic 7.5% |
| Immigrants | Azores | 0.1 /100 | #272 | Tragic 7.5% |
Demographics Similar to Immigrants from Canada by Single Mother Households
In terms of single mother households, the demographic groups most similar to Immigrants from Canada are Italian (5.6%, a difference of 0.020%), Immigrants from Bulgaria (5.6%, a difference of 0.080%), Greek (5.6%, a difference of 0.10%), Asian (5.6%, a difference of 0.11%), and Immigrants from France (5.6%, a difference of 0.15%).
| Demographics | Rating | Rank | Single Mother Households |
| Luxembourgers | 98.7 /100 | #59 | Exceptional 5.6% |
| Immigrants | Norway | 98.7 /100 | #60 | Exceptional 5.6% |
| Australians | 98.7 /100 | #61 | Exceptional 5.6% |
| Poles | 98.6 /100 | #62 | Exceptional 5.6% |
| Immigrants | North Macedonia | 98.6 /100 | #63 | Exceptional 5.6% |
| Immigrants | France | 98.6 /100 | #64 | Exceptional 5.6% |
| Greeks | 98.6 /100 | #65 | Exceptional 5.6% |
| Immigrants | Canada | 98.5 /100 | #66 | Exceptional 5.6% |
| Italians | 98.5 /100 | #67 | Exceptional 5.6% |
| Immigrants | Bulgaria | 98.5 /100 | #68 | Exceptional 5.6% |
| Asians | 98.5 /100 | #69 | Exceptional 5.6% |
| Immigrants | Eastern Europe | 98.4 /100 | #70 | Exceptional 5.6% |
| Immigrants | Kazakhstan | 98.4 /100 | #71 | Exceptional 5.6% |
| Immigrants | Netherlands | 98.4 /100 | #72 | Exceptional 5.6% |
| Immigrants | Asia | 98.4 /100 | #73 | Exceptional 5.6% |