Slovak vs Immigrants from Oceania Single Mother Households
COMPARE
Slovak
Immigrants from Oceania
Single Mother Households
Single Mother Households Comparison
Slovaks
Immigrants from Oceania
5.7%
SINGLE MOTHER HOUSEHOLDS
96.6/ 100
METRIC RATING
95th/ 347
METRIC RANK
6.3%
SINGLE MOTHER HOUSEHOLDS
54.6/ 100
METRIC RATING
170th/ 347
METRIC RANK
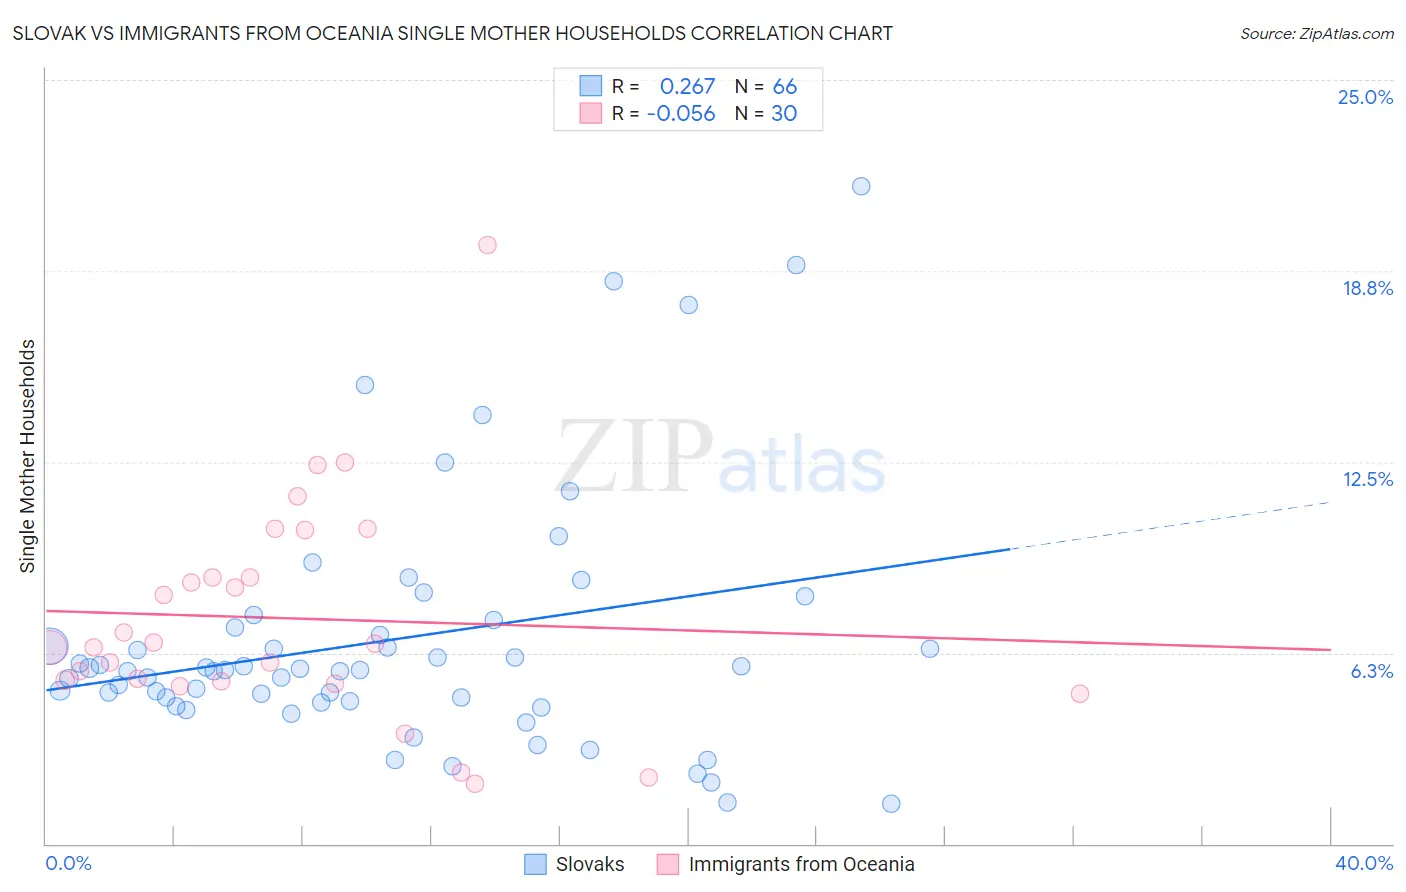
Slovak vs Immigrants from Oceania Single Mother Households Correlation Chart
The statistical analysis conducted on geographies consisting of 396,232,122 people shows a weak positive correlation between the proportion of Slovaks and percentage of single mother households in the United States with a correlation coefficient (R) of 0.267 and weighted average of 5.7%. Similarly, the statistical analysis conducted on geographies consisting of 304,825,048 people shows a slight negative correlation between the proportion of Immigrants from Oceania and percentage of single mother households in the United States with a correlation coefficient (R) of -0.056 and weighted average of 6.3%, a difference of 9.5%.
Single Mother Households Correlation Summary
| Measurement | Slovak | Immigrants from Oceania |
| Minimum | 1.3% | 2.0% |
| Maximum | 21.5% | 19.6% |
| Range | 20.2% | 17.6% |
| Mean | 6.7% | 7.4% |
| Median | 5.7% | 6.5% |
| Interquartile 25% (IQ1) | 4.7% | 5.3% |
| Interquartile 75% (IQ3) | 7.1% | 8.7% |
| Interquartile Range (IQR) | 2.4% | 3.4% |
| Standard Deviation (Sample) | 4.1% | 3.6% |
| Standard Deviation (Population) | 4.1% | 3.6% |
Similar Demographics by Single Mother Households
Demographics Similar to Slovaks by Single Mother Households
In terms of single mother households, the demographic groups most similar to Slovaks are Basque (5.7%, a difference of 0.060%), Serbian (5.7%, a difference of 0.11%), Immigrants from Western Asia (5.7%, a difference of 0.12%), Austrian (5.7%, a difference of 0.15%), and Tlingit-Haida (5.7%, a difference of 0.20%).
| Demographics | Rating | Rank | Single Mother Households |
| Israelis | 97.4 /100 | #88 | Exceptional 5.7% |
| Ukrainians | 97.2 /100 | #89 | Exceptional 5.7% |
| Immigrants | Indonesia | 97.2 /100 | #90 | Exceptional 5.7% |
| Europeans | 97.0 /100 | #91 | Exceptional 5.7% |
| Immigrants | Western Asia | 96.7 /100 | #92 | Exceptional 5.7% |
| Serbians | 96.7 /100 | #93 | Exceptional 5.7% |
| Basques | 96.7 /100 | #94 | Exceptional 5.7% |
| Slovaks | 96.6 /100 | #95 | Exceptional 5.7% |
| Austrians | 96.4 /100 | #96 | Exceptional 5.7% |
| Tlingit-Haida | 96.4 /100 | #97 | Exceptional 5.7% |
| Immigrants | South Africa | 96.3 /100 | #98 | Exceptional 5.7% |
| Immigrants | Poland | 96.3 /100 | #99 | Exceptional 5.8% |
| Scandinavians | 96.2 /100 | #100 | Exceptional 5.8% |
| Germans | 96.2 /100 | #101 | Exceptional 5.8% |
| English | 96.2 /100 | #102 | Exceptional 5.8% |
Demographics Similar to Immigrants from Oceania by Single Mother Households
In terms of single mother households, the demographic groups most similar to Immigrants from Oceania are Afghan (6.3%, a difference of 0.23%), Immigrants from South Eastern Asia (6.3%, a difference of 0.26%), Immigrants from Vietnam (6.3%, a difference of 0.34%), Puget Sound Salish (6.3%, a difference of 0.40%), and Immigrants from Chile (6.3%, a difference of 0.42%).
| Demographics | Rating | Rank | Single Mother Households |
| Alsatians | 68.7 /100 | #163 | Good 6.2% |
| Immigrants | Northern Africa | 68.0 /100 | #164 | Good 6.2% |
| Immigrants | Syria | 67.4 /100 | #165 | Good 6.2% |
| Sri Lankans | 63.9 /100 | #166 | Good 6.2% |
| Brazilians | 59.1 /100 | #167 | Average 6.2% |
| Immigrants | Chile | 58.3 /100 | #168 | Average 6.3% |
| Puget Sound Salish | 58.1 /100 | #169 | Average 6.3% |
| Immigrants | Oceania | 54.6 /100 | #170 | Average 6.3% |
| Afghans | 52.5 /100 | #171 | Average 6.3% |
| Immigrants | South Eastern Asia | 52.2 /100 | #172 | Average 6.3% |
| Immigrants | Vietnam | 51.5 /100 | #173 | Average 6.3% |
| Immigrants | Morocco | 50.0 /100 | #174 | Average 6.3% |
| Marshallese | 45.8 /100 | #175 | Average 6.3% |
| Immigrants | Bosnia and Herzegovina | 44.3 /100 | #176 | Average 6.3% |
| Osage | 43.0 /100 | #177 | Average 6.4% |