Spanish American Indian vs Immigrants from Oceania Single Mother Households
COMPARE
Spanish American Indian
Immigrants from Oceania
Single Mother Households
Single Mother Households Comparison
Spanish American Indians
Immigrants from Oceania
7.3%
SINGLE MOTHER HOUSEHOLDS
0.4/ 100
METRIC RATING
248th/ 347
METRIC RANK
6.3%
SINGLE MOTHER HOUSEHOLDS
54.6/ 100
METRIC RATING
170th/ 347
METRIC RANK
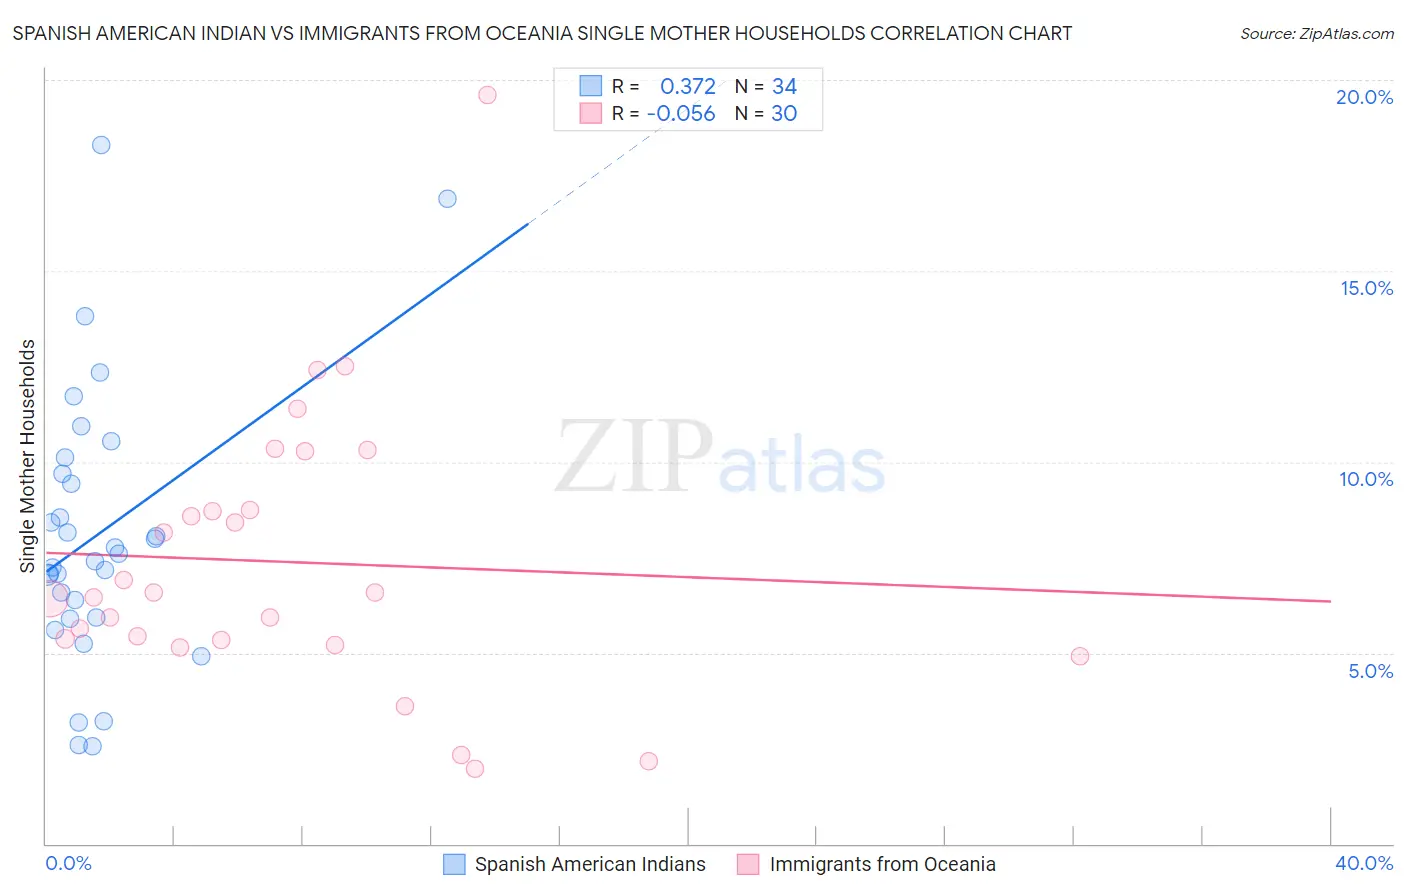
Spanish American Indian vs Immigrants from Oceania Single Mother Households Correlation Chart
The statistical analysis conducted on geographies consisting of 73,133,318 people shows a mild positive correlation between the proportion of Spanish American Indians and percentage of single mother households in the United States with a correlation coefficient (R) of 0.372 and weighted average of 7.3%. Similarly, the statistical analysis conducted on geographies consisting of 304,825,048 people shows a slight negative correlation between the proportion of Immigrants from Oceania and percentage of single mother households in the United States with a correlation coefficient (R) of -0.056 and weighted average of 6.3%, a difference of 15.6%.
Single Mother Households Correlation Summary
| Measurement | Spanish American Indian | Immigrants from Oceania |
| Minimum | 2.6% | 2.0% |
| Maximum | 18.3% | 19.6% |
| Range | 15.7% | 17.6% |
| Mean | 8.1% | 7.4% |
| Median | 7.5% | 6.5% |
| Interquartile 25% (IQ1) | 5.9% | 5.3% |
| Interquartile 75% (IQ3) | 9.7% | 8.7% |
| Interquartile Range (IQR) | 3.8% | 3.4% |
| Standard Deviation (Sample) | 3.6% | 3.6% |
| Standard Deviation (Population) | 3.5% | 3.6% |
Similar Demographics by Single Mother Households
Demographics Similar to Spanish American Indians by Single Mother Households
In terms of single mother households, the demographic groups most similar to Spanish American Indians are Dutch West Indian (7.3%, a difference of 0.030%), Nicaraguan (7.2%, a difference of 0.28%), Bermudan (7.3%, a difference of 0.29%), Immigrants from Africa (7.3%, a difference of 0.30%), and Immigrants from Cambodia (7.2%, a difference of 0.46%).
| Demographics | Rating | Rank | Single Mother Households |
| Immigrants | Portugal | 0.6 /100 | #241 | Tragic 7.2% |
| Fijians | 0.6 /100 | #242 | Tragic 7.2% |
| Ecuadorians | 0.6 /100 | #243 | Tragic 7.2% |
| Cubans | 0.6 /100 | #244 | Tragic 7.2% |
| Immigrants | Cambodia | 0.5 /100 | #245 | Tragic 7.2% |
| Nicaraguans | 0.5 /100 | #246 | Tragic 7.2% |
| Dutch West Indians | 0.4 /100 | #247 | Tragic 7.3% |
| Spanish American Indians | 0.4 /100 | #248 | Tragic 7.3% |
| Bermudans | 0.4 /100 | #249 | Tragic 7.3% |
| Immigrants | Africa | 0.4 /100 | #250 | Tragic 7.3% |
| Malaysians | 0.3 /100 | #251 | Tragic 7.3% |
| Alaskan Athabascans | 0.3 /100 | #252 | Tragic 7.3% |
| Cajuns | 0.3 /100 | #253 | Tragic 7.3% |
| Immigrants | Ecuador | 0.3 /100 | #254 | Tragic 7.3% |
| Mexican American Indians | 0.2 /100 | #255 | Tragic 7.4% |
Demographics Similar to Immigrants from Oceania by Single Mother Households
In terms of single mother households, the demographic groups most similar to Immigrants from Oceania are Afghan (6.3%, a difference of 0.23%), Immigrants from South Eastern Asia (6.3%, a difference of 0.26%), Immigrants from Vietnam (6.3%, a difference of 0.34%), Puget Sound Salish (6.3%, a difference of 0.40%), and Immigrants from Chile (6.3%, a difference of 0.42%).
| Demographics | Rating | Rank | Single Mother Households |
| Alsatians | 68.7 /100 | #163 | Good 6.2% |
| Immigrants | Northern Africa | 68.0 /100 | #164 | Good 6.2% |
| Immigrants | Syria | 67.4 /100 | #165 | Good 6.2% |
| Sri Lankans | 63.9 /100 | #166 | Good 6.2% |
| Brazilians | 59.1 /100 | #167 | Average 6.2% |
| Immigrants | Chile | 58.3 /100 | #168 | Average 6.3% |
| Puget Sound Salish | 58.1 /100 | #169 | Average 6.3% |
| Immigrants | Oceania | 54.6 /100 | #170 | Average 6.3% |
| Afghans | 52.5 /100 | #171 | Average 6.3% |
| Immigrants | South Eastern Asia | 52.2 /100 | #172 | Average 6.3% |
| Immigrants | Vietnam | 51.5 /100 | #173 | Average 6.3% |
| Immigrants | Morocco | 50.0 /100 | #174 | Average 6.3% |
| Marshallese | 45.8 /100 | #175 | Average 6.3% |
| Immigrants | Bosnia and Herzegovina | 44.3 /100 | #176 | Average 6.3% |
| Osage | 43.0 /100 | #177 | Average 6.4% |