Immigrants from Afghanistan vs Immigrants from Oceania Single Mother Households
COMPARE
Immigrants from Afghanistan
Immigrants from Oceania
Single Mother Households
Single Mother Households Comparison
Immigrants from Afghanistan
Immigrants from Oceania
6.5%
SINGLE MOTHER HOUSEHOLDS
24.7/ 100
METRIC RATING
187th/ 347
METRIC RANK
6.3%
SINGLE MOTHER HOUSEHOLDS
54.6/ 100
METRIC RATING
170th/ 347
METRIC RANK
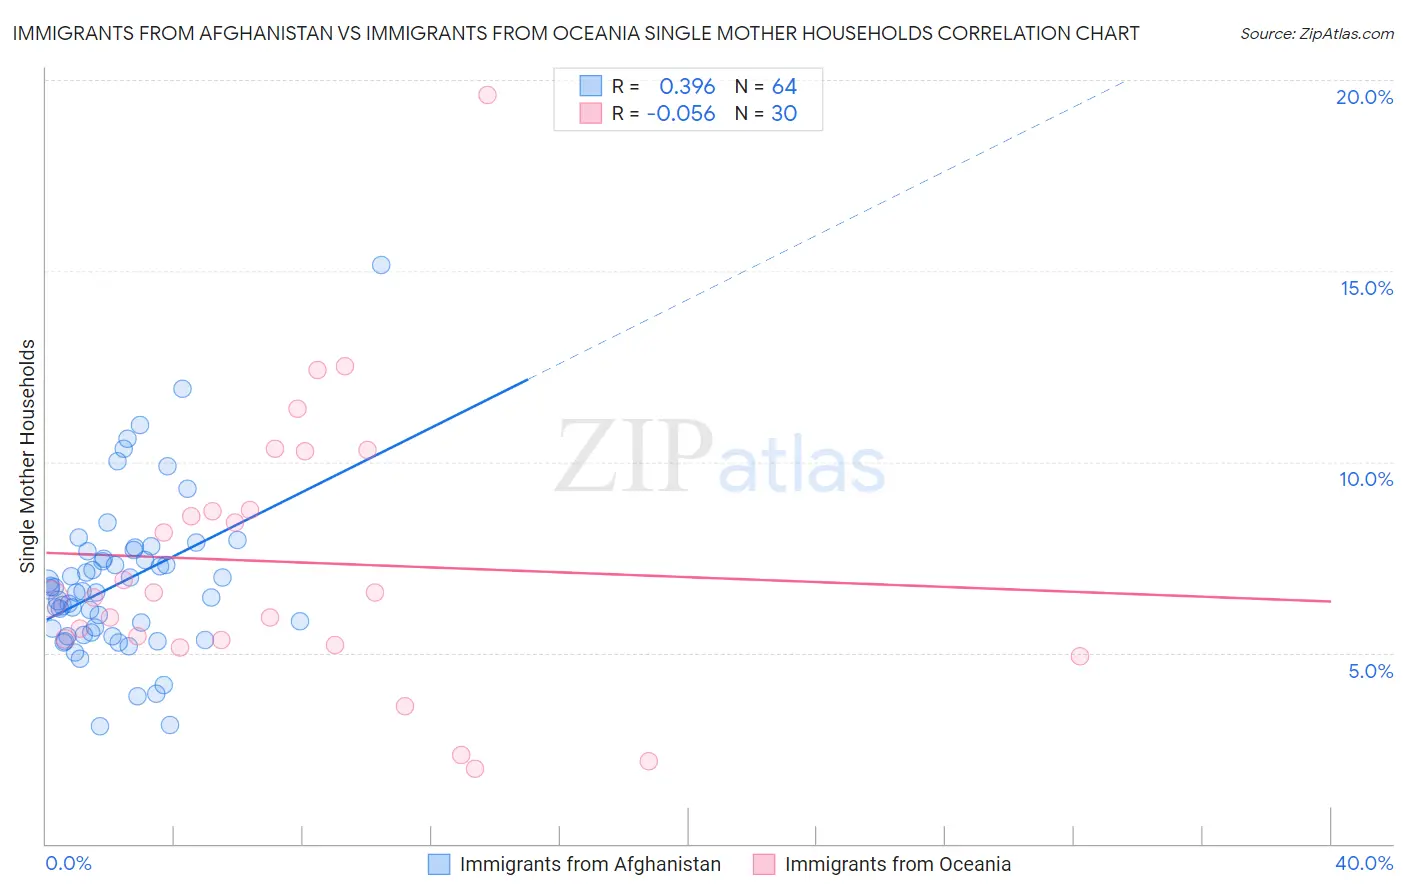
Immigrants from Afghanistan vs Immigrants from Oceania Single Mother Households Correlation Chart
The statistical analysis conducted on geographies consisting of 147,513,852 people shows a mild positive correlation between the proportion of Immigrants from Afghanistan and percentage of single mother households in the United States with a correlation coefficient (R) of 0.396 and weighted average of 6.5%. Similarly, the statistical analysis conducted on geographies consisting of 304,825,048 people shows a slight negative correlation between the proportion of Immigrants from Oceania and percentage of single mother households in the United States with a correlation coefficient (R) of -0.056 and weighted average of 6.3%, a difference of 3.6%.
Single Mother Households Correlation Summary
| Measurement | Immigrants from Afghanistan | Immigrants from Oceania |
| Minimum | 3.1% | 2.0% |
| Maximum | 15.1% | 19.6% |
| Range | 12.1% | 17.6% |
| Mean | 6.8% | 7.4% |
| Median | 6.6% | 6.5% |
| Interquartile 25% (IQ1) | 5.5% | 5.3% |
| Interquartile 75% (IQ3) | 7.6% | 8.7% |
| Interquartile Range (IQR) | 2.1% | 3.4% |
| Standard Deviation (Sample) | 2.1% | 3.6% |
| Standard Deviation (Population) | 2.0% | 3.6% |
Demographics Similar to Immigrants from Afghanistan and Immigrants from Oceania by Single Mother Households
In terms of single mother households, the demographic groups most similar to Immigrants from Afghanistan are Costa Rican (6.5%, a difference of 0.020%), Ugandan (6.5%, a difference of 0.13%), Ottawa (6.5%, a difference of 0.13%), Ethiopian (6.5%, a difference of 0.19%), and Spaniard (6.5%, a difference of 0.43%). Similarly, the demographic groups most similar to Immigrants from Oceania are Afghan (6.3%, a difference of 0.23%), Immigrants from South Eastern Asia (6.3%, a difference of 0.26%), Immigrants from Vietnam (6.3%, a difference of 0.34%), Puget Sound Salish (6.3%, a difference of 0.40%), and Immigrants from Chile (6.3%, a difference of 0.42%).
| Demographics | Rating | Rank | Single Mother Households |
| Immigrants | Chile | 58.3 /100 | #168 | Average 6.3% |
| Puget Sound Salish | 58.1 /100 | #169 | Average 6.3% |
| Immigrants | Oceania | 54.6 /100 | #170 | Average 6.3% |
| Afghans | 52.5 /100 | #171 | Average 6.3% |
| Immigrants | South Eastern Asia | 52.2 /100 | #172 | Average 6.3% |
| Immigrants | Vietnam | 51.5 /100 | #173 | Average 6.3% |
| Immigrants | Morocco | 50.0 /100 | #174 | Average 6.3% |
| Marshallese | 45.8 /100 | #175 | Average 6.3% |
| Immigrants | Bosnia and Herzegovina | 44.3 /100 | #176 | Average 6.3% |
| Osage | 43.0 /100 | #177 | Average 6.4% |
| Portuguese | 40.0 /100 | #178 | Fair 6.4% |
| Hmong | 39.8 /100 | #179 | Fair 6.4% |
| Immigrants | Nepal | 36.1 /100 | #180 | Fair 6.4% |
| Spanish | 33.4 /100 | #181 | Fair 6.4% |
| South American Indians | 33.4 /100 | #182 | Fair 6.4% |
| Spaniards | 27.8 /100 | #183 | Fair 6.5% |
| Ethiopians | 26.0 /100 | #184 | Fair 6.5% |
| Ugandans | 25.6 /100 | #185 | Fair 6.5% |
| Costa Ricans | 24.8 /100 | #186 | Fair 6.5% |
| Immigrants | Afghanistan | 24.7 /100 | #187 | Fair 6.5% |
| Ottawa | 23.8 /100 | #188 | Fair 6.5% |