Croatian vs Apache Single Mother Households
COMPARE
Croatian
Apache
Single Mother Households
Single Mother Households Comparison
Croatians
Apache
5.5%
SINGLE MOTHER HOUSEHOLDS
99.3/ 100
METRIC RATING
46th/ 347
METRIC RANK
7.9%
SINGLE MOTHER HOUSEHOLDS
0.0/ 100
METRIC RATING
294th/ 347
METRIC RANK
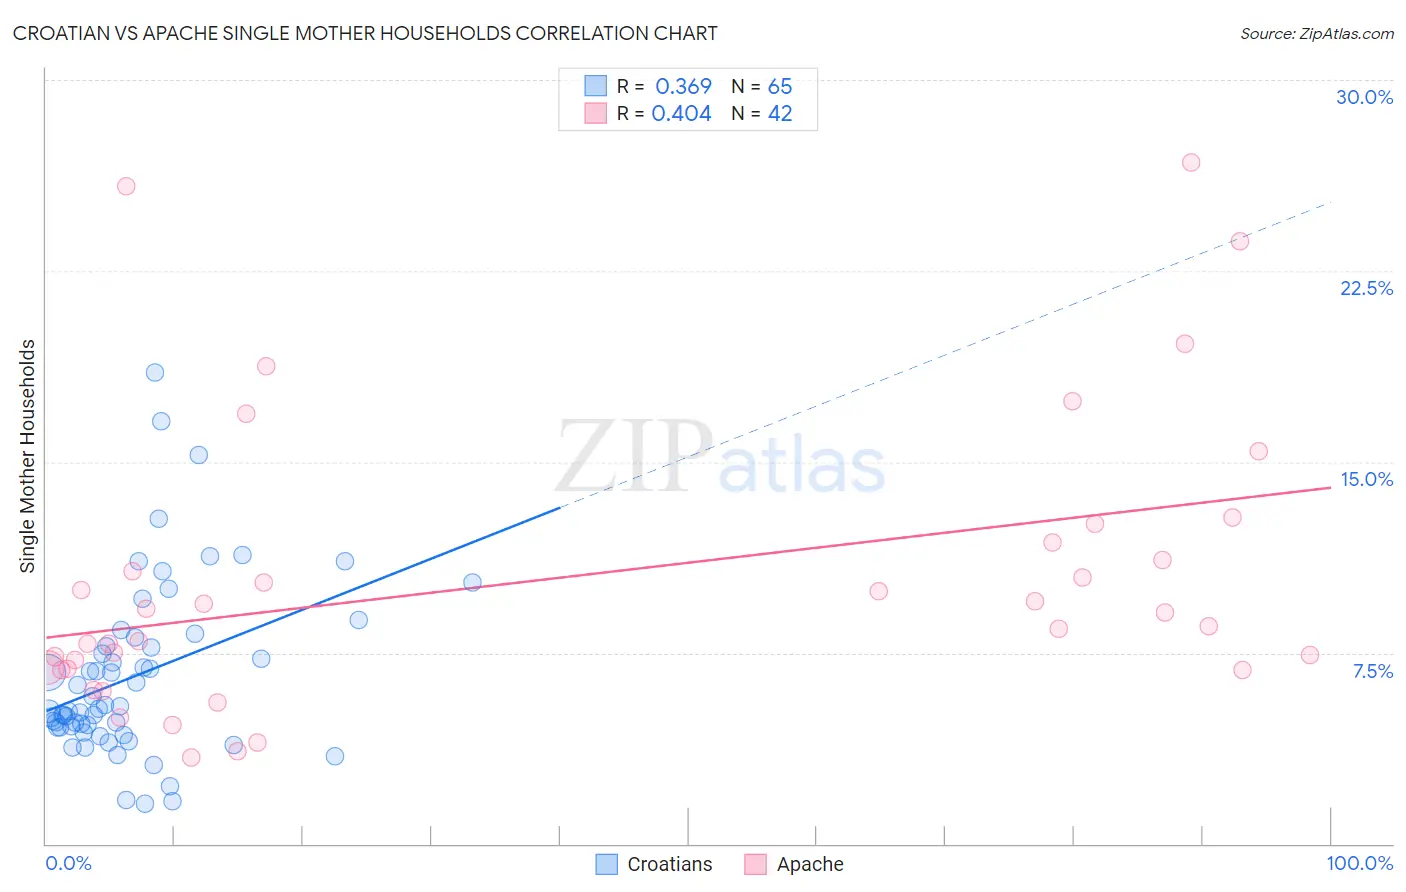
Croatian vs Apache Single Mother Households Correlation Chart
The statistical analysis conducted on geographies consisting of 374,465,881 people shows a mild positive correlation between the proportion of Croatians and percentage of single mother households in the United States with a correlation coefficient (R) of 0.369 and weighted average of 5.5%. Similarly, the statistical analysis conducted on geographies consisting of 230,770,959 people shows a moderate positive correlation between the proportion of Apache and percentage of single mother households in the United States with a correlation coefficient (R) of 0.404 and weighted average of 7.9%, a difference of 44.5%.
Single Mother Households Correlation Summary
| Measurement | Croatian | Apache |
| Minimum | 1.6% | 3.4% |
| Maximum | 18.5% | 26.8% |
| Range | 16.9% | 23.4% |
| Mean | 6.6% | 10.4% |
| Median | 5.3% | 8.8% |
| Interquartile 25% (IQ1) | 4.6% | 6.9% |
| Interquartile 75% (IQ3) | 7.9% | 11.8% |
| Interquartile Range (IQR) | 3.4% | 5.0% |
| Standard Deviation (Sample) | 3.4% | 5.7% |
| Standard Deviation (Population) | 3.4% | 5.7% |
Similar Demographics by Single Mother Households
Demographics Similar to Croatians by Single Mother Households
In terms of single mother households, the demographic groups most similar to Croatians are Norwegian (5.5%, a difference of 0.18%), Immigrants from Croatia (5.4%, a difference of 0.26%), Lithuanian (5.4%, a difference of 0.38%), Turkish (5.5%, a difference of 0.38%), and Immigrants from Latvia (5.5%, a difference of 0.41%).
| Demographics | Rating | Rank | Single Mother Households |
| Immigrants | Sweden | 99.6 /100 | #39 | Exceptional 5.4% |
| Estonians | 99.6 /100 | #40 | Exceptional 5.4% |
| Immigrants | Greece | 99.5 /100 | #41 | Exceptional 5.4% |
| Macedonians | 99.5 /100 | #42 | Exceptional 5.4% |
| Immigrants | South Central Asia | 99.5 /100 | #43 | Exceptional 5.4% |
| Lithuanians | 99.4 /100 | #44 | Exceptional 5.4% |
| Immigrants | Croatia | 99.4 /100 | #45 | Exceptional 5.4% |
| Croatians | 99.3 /100 | #46 | Exceptional 5.5% |
| Norwegians | 99.3 /100 | #47 | Exceptional 5.5% |
| Turks | 99.2 /100 | #48 | Exceptional 5.5% |
| Immigrants | Latvia | 99.2 /100 | #49 | Exceptional 5.5% |
| Immigrants | Scotland | 99.2 /100 | #50 | Exceptional 5.5% |
| Immigrants | Belarus | 99.2 /100 | #51 | Exceptional 5.5% |
| Swedes | 99.1 /100 | #52 | Exceptional 5.5% |
| Immigrants | Russia | 99.1 /100 | #53 | Exceptional 5.5% |
Demographics Similar to Apache by Single Mother Households
In terms of single mother households, the demographic groups most similar to Apache are Immigrants from Cameroon (7.9%, a difference of 0.10%), Barbadian (7.9%, a difference of 0.29%), Immigrants from Latin America (7.9%, a difference of 0.35%), Hispanic or Latino (7.9%, a difference of 0.39%), and Ghanaian (7.8%, a difference of 0.46%).
| Demographics | Rating | Rank | Single Mother Households |
| Immigrants | Guatemala | 0.0 /100 | #287 | Tragic 7.7% |
| Sierra Leoneans | 0.0 /100 | #288 | Tragic 7.7% |
| Sub-Saharan Africans | 0.0 /100 | #289 | Tragic 7.8% |
| Immigrants | Nigeria | 0.0 /100 | #290 | Tragic 7.8% |
| West Indians | 0.0 /100 | #291 | Tragic 7.8% |
| Ghanaians | 0.0 /100 | #292 | Tragic 7.8% |
| Immigrants | Cameroon | 0.0 /100 | #293 | Tragic 7.9% |
| Apache | 0.0 /100 | #294 | Tragic 7.9% |
| Barbadians | 0.0 /100 | #295 | Tragic 7.9% |
| Immigrants | Latin America | 0.0 /100 | #296 | Tragic 7.9% |
| Hispanics or Latinos | 0.0 /100 | #297 | Tragic 7.9% |
| Immigrants | West Indies | 0.0 /100 | #298 | Tragic 7.9% |
| Houma | 0.0 /100 | #299 | Tragic 7.9% |
| Mexicans | 0.0 /100 | #300 | Tragic 8.0% |
| Chippewa | 0.0 /100 | #301 | Tragic 8.0% |