Shoshone vs Greek Divorced or Separated
COMPARE
Shoshone
Greek
Divorced or Separated
Divorced or Separated Comparison
Shoshone
Greeks
14.0%
DIVORCED OR SEPARATED
0.0/ 100
METRIC RATING
336th/ 347
METRIC RANK
11.7%
DIVORCED OR SEPARATED
96.9/ 100
METRIC RATING
108th/ 347
METRIC RANK
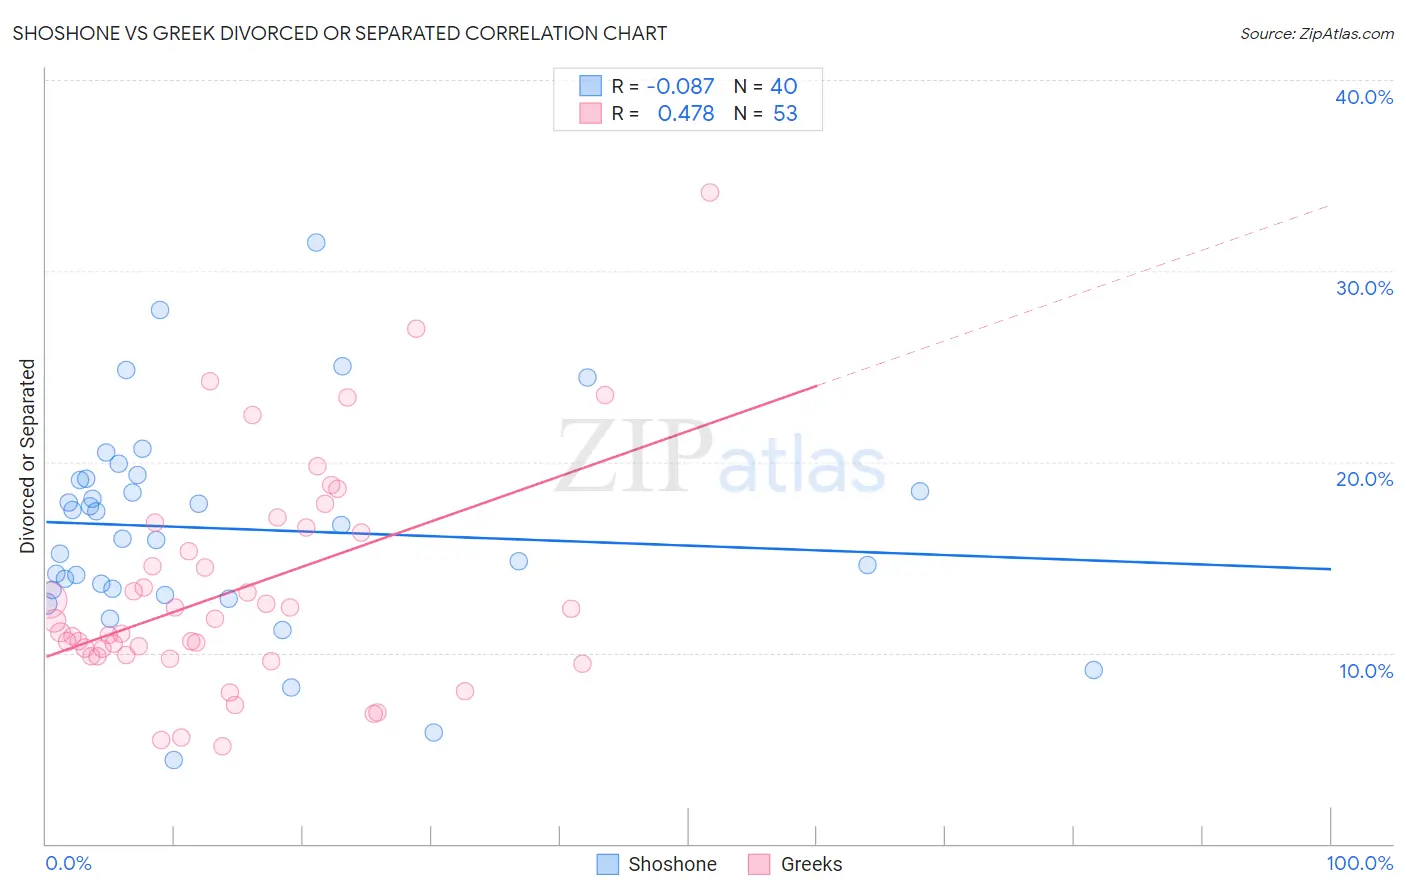
Shoshone vs Greek Divorced or Separated Correlation Chart
The statistical analysis conducted on geographies consisting of 66,626,877 people shows a slight negative correlation between the proportion of Shoshone and percentage of population currently divorced or separated in the United States with a correlation coefficient (R) of -0.087 and weighted average of 14.0%. Similarly, the statistical analysis conducted on geographies consisting of 482,480,692 people shows a moderate positive correlation between the proportion of Greeks and percentage of population currently divorced or separated in the United States with a correlation coefficient (R) of 0.478 and weighted average of 11.7%, a difference of 20.1%.
Divorced or Separated Correlation Summary
| Measurement | Shoshone | Greek |
| Minimum | 4.4% | 5.1% |
| Maximum | 31.5% | 34.1% |
| Range | 27.1% | 29.0% |
| Mean | 16.5% | 13.3% |
| Median | 16.4% | 11.7% |
| Interquartile 25% (IQ1) | 13.3% | 9.9% |
| Interquartile 75% (IQ3) | 19.1% | 16.4% |
| Interquartile Range (IQR) | 5.7% | 6.6% |
| Standard Deviation (Sample) | 5.5% | 5.8% |
| Standard Deviation (Population) | 5.4% | 5.7% |
Similar Demographics by Divorced or Separated
Demographics Similar to Shoshone by Divorced or Separated
In terms of divorced or separated, the demographic groups most similar to Shoshone are Crow (14.1%, a difference of 0.28%), Dutch West Indian (14.0%, a difference of 0.34%), Choctaw (14.1%, a difference of 0.60%), Immigrants from Bahamas (13.9%, a difference of 0.95%), and Colville (14.2%, a difference of 1.1%).
| Demographics | Rating | Rank | Divorced or Separated |
| Houma | 0.0 /100 | #329 | Tragic 13.6% |
| Paiute | 0.0 /100 | #330 | Tragic 13.6% |
| Blacks/African Americans | 0.0 /100 | #331 | Tragic 13.6% |
| Cherokee | 0.0 /100 | #332 | Tragic 13.7% |
| Puerto Ricans | 0.0 /100 | #333 | Tragic 13.9% |
| Immigrants | Bahamas | 0.0 /100 | #334 | Tragic 13.9% |
| Dutch West Indians | 0.0 /100 | #335 | Tragic 14.0% |
| Shoshone | 0.0 /100 | #336 | Tragic 14.0% |
| Crow | 0.0 /100 | #337 | Tragic 14.1% |
| Choctaw | 0.0 /100 | #338 | Tragic 14.1% |
| Colville | 0.0 /100 | #339 | Tragic 14.2% |
| Chickasaw | 0.0 /100 | #340 | Tragic 14.2% |
| Bahamians | 0.0 /100 | #341 | Tragic 14.2% |
| Seminole | 0.0 /100 | #342 | Tragic 14.3% |
| Creek | 0.0 /100 | #343 | Tragic 14.4% |
Demographics Similar to Greeks by Divorced or Separated
In terms of divorced or separated, the demographic groups most similar to Greeks are Immigrants from South Africa (11.7%, a difference of 0.010%), Immigrants from Czechoslovakia (11.7%, a difference of 0.010%), Immigrants from Spain (11.7%, a difference of 0.050%), Native Hawaiian (11.7%, a difference of 0.090%), and Immigrants from France (11.7%, a difference of 0.10%).
| Demographics | Rating | Rank | Divorced or Separated |
| Immigrants | Guyana | 98.5 /100 | #101 | Exceptional 11.6% |
| Immigrants | Croatia | 98.3 /100 | #102 | Exceptional 11.6% |
| Maltese | 98.2 /100 | #103 | Exceptional 11.6% |
| Salvadorans | 98.2 /100 | #104 | Exceptional 11.6% |
| Immigrants | El Salvador | 97.9 /100 | #105 | Exceptional 11.7% |
| Immigrants | Kazakhstan | 97.8 /100 | #106 | Exceptional 11.7% |
| Native Hawaiians | 97.2 /100 | #107 | Exceptional 11.7% |
| Greeks | 96.9 /100 | #108 | Exceptional 11.7% |
| Immigrants | South Africa | 96.9 /100 | #109 | Exceptional 11.7% |
| Immigrants | Czechoslovakia | 96.9 /100 | #110 | Exceptional 11.7% |
| Immigrants | Spain | 96.8 /100 | #111 | Exceptional 11.7% |
| Immigrants | France | 96.6 /100 | #112 | Exceptional 11.7% |
| Estonians | 96.6 /100 | #113 | Exceptional 11.7% |
| Immigrants | Norway | 95.9 /100 | #114 | Exceptional 11.7% |
| Lithuanians | 95.7 /100 | #115 | Exceptional 11.7% |