Afghan vs Greek Divorced or Separated
COMPARE
Afghan
Greek
Divorced or Separated
Divorced or Separated Comparison
Afghans
Greeks
11.5%
DIVORCED OR SEPARATED
99.4/ 100
METRIC RATING
78th/ 347
METRIC RANK
11.7%
DIVORCED OR SEPARATED
96.9/ 100
METRIC RATING
108th/ 347
METRIC RANK
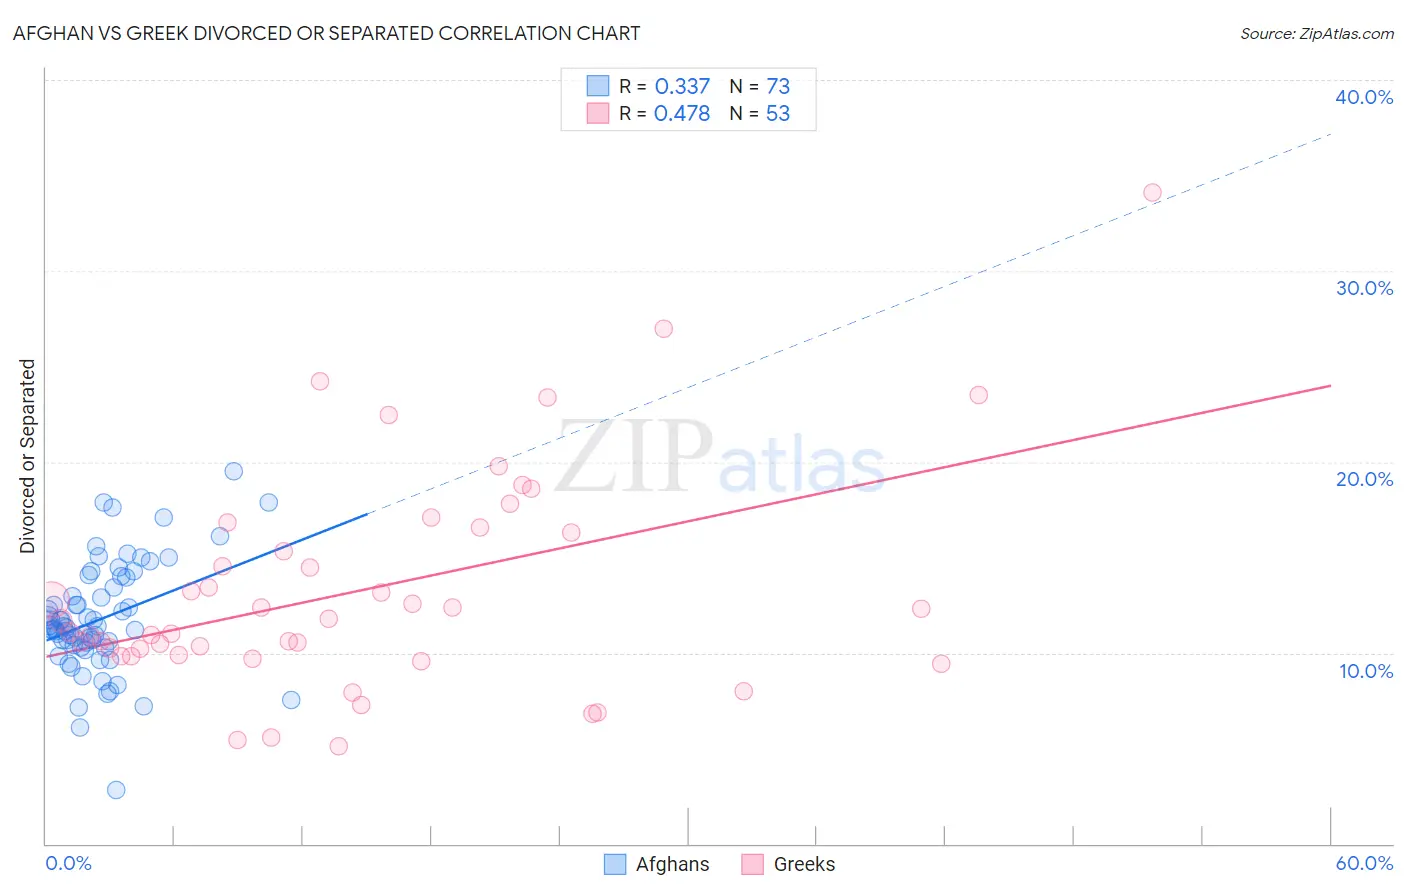
Afghan vs Greek Divorced or Separated Correlation Chart
The statistical analysis conducted on geographies consisting of 148,858,347 people shows a mild positive correlation between the proportion of Afghans and percentage of population currently divorced or separated in the United States with a correlation coefficient (R) of 0.337 and weighted average of 11.5%. Similarly, the statistical analysis conducted on geographies consisting of 482,480,692 people shows a moderate positive correlation between the proportion of Greeks and percentage of population currently divorced or separated in the United States with a correlation coefficient (R) of 0.478 and weighted average of 11.7%, a difference of 1.6%.
Divorced or Separated Correlation Summary
| Measurement | Afghan | Greek |
| Minimum | 2.8% | 5.1% |
| Maximum | 19.5% | 34.1% |
| Range | 16.7% | 29.0% |
| Mean | 11.8% | 13.3% |
| Median | 11.4% | 11.7% |
| Interquartile 25% (IQ1) | 10.3% | 9.9% |
| Interquartile 75% (IQ3) | 13.7% | 16.4% |
| Interquartile Range (IQR) | 3.3% | 6.6% |
| Standard Deviation (Sample) | 2.9% | 5.8% |
| Standard Deviation (Population) | 2.9% | 5.7% |
Similar Demographics by Divorced or Separated
Demographics Similar to Afghans by Divorced or Separated
In terms of divorced or separated, the demographic groups most similar to Afghans are Guyanese (11.5%, a difference of 0.040%), Immigrants from Switzerland (11.5%, a difference of 0.060%), Russian (11.5%, a difference of 0.070%), Immigrants from Italy (11.5%, a difference of 0.10%), and Immigrants from Romania (11.5%, a difference of 0.15%).
| Demographics | Rating | Rank | Divorced or Separated |
| Paraguayans | 99.7 /100 | #71 | Exceptional 11.5% |
| Jordanians | 99.6 /100 | #72 | Exceptional 11.5% |
| Immigrants | North Macedonia | 99.6 /100 | #73 | Exceptional 11.5% |
| Taiwanese | 99.6 /100 | #74 | Exceptional 11.5% |
| Immigrants | Northern Africa | 99.6 /100 | #75 | Exceptional 11.5% |
| Albanians | 99.6 /100 | #76 | Exceptional 11.5% |
| Immigrants | Italy | 99.5 /100 | #77 | Exceptional 11.5% |
| Afghans | 99.4 /100 | #78 | Exceptional 11.5% |
| Guyanese | 99.4 /100 | #79 | Exceptional 11.5% |
| Immigrants | Switzerland | 99.4 /100 | #80 | Exceptional 11.5% |
| Russians | 99.4 /100 | #81 | Exceptional 11.5% |
| Immigrants | Romania | 99.3 /100 | #82 | Exceptional 11.5% |
| Immigrants | Bulgaria | 99.3 /100 | #83 | Exceptional 11.5% |
| Bulgarians | 99.3 /100 | #84 | Exceptional 11.5% |
| Immigrants | Albania | 99.3 /100 | #85 | Exceptional 11.5% |
Demographics Similar to Greeks by Divorced or Separated
In terms of divorced or separated, the demographic groups most similar to Greeks are Immigrants from South Africa (11.7%, a difference of 0.010%), Immigrants from Czechoslovakia (11.7%, a difference of 0.010%), Immigrants from Spain (11.7%, a difference of 0.050%), Native Hawaiian (11.7%, a difference of 0.090%), and Immigrants from France (11.7%, a difference of 0.10%).
| Demographics | Rating | Rank | Divorced or Separated |
| Immigrants | Guyana | 98.5 /100 | #101 | Exceptional 11.6% |
| Immigrants | Croatia | 98.3 /100 | #102 | Exceptional 11.6% |
| Maltese | 98.2 /100 | #103 | Exceptional 11.6% |
| Salvadorans | 98.2 /100 | #104 | Exceptional 11.6% |
| Immigrants | El Salvador | 97.9 /100 | #105 | Exceptional 11.7% |
| Immigrants | Kazakhstan | 97.8 /100 | #106 | Exceptional 11.7% |
| Native Hawaiians | 97.2 /100 | #107 | Exceptional 11.7% |
| Greeks | 96.9 /100 | #108 | Exceptional 11.7% |
| Immigrants | South Africa | 96.9 /100 | #109 | Exceptional 11.7% |
| Immigrants | Czechoslovakia | 96.9 /100 | #110 | Exceptional 11.7% |
| Immigrants | Spain | 96.8 /100 | #111 | Exceptional 11.7% |
| Immigrants | France | 96.6 /100 | #112 | Exceptional 11.7% |
| Estonians | 96.6 /100 | #113 | Exceptional 11.7% |
| Immigrants | Norway | 95.9 /100 | #114 | Exceptional 11.7% |
| Lithuanians | 95.7 /100 | #115 | Exceptional 11.7% |