Immigrants from West Indies vs Greek Divorced or Separated
COMPARE
Immigrants from West Indies
Greek
Divorced or Separated
Divorced or Separated Comparison
Immigrants from West Indies
Greeks
12.5%
DIVORCED OR SEPARATED
1.9/ 100
METRIC RATING
246th/ 347
METRIC RANK
11.7%
DIVORCED OR SEPARATED
96.9/ 100
METRIC RATING
108th/ 347
METRIC RANK
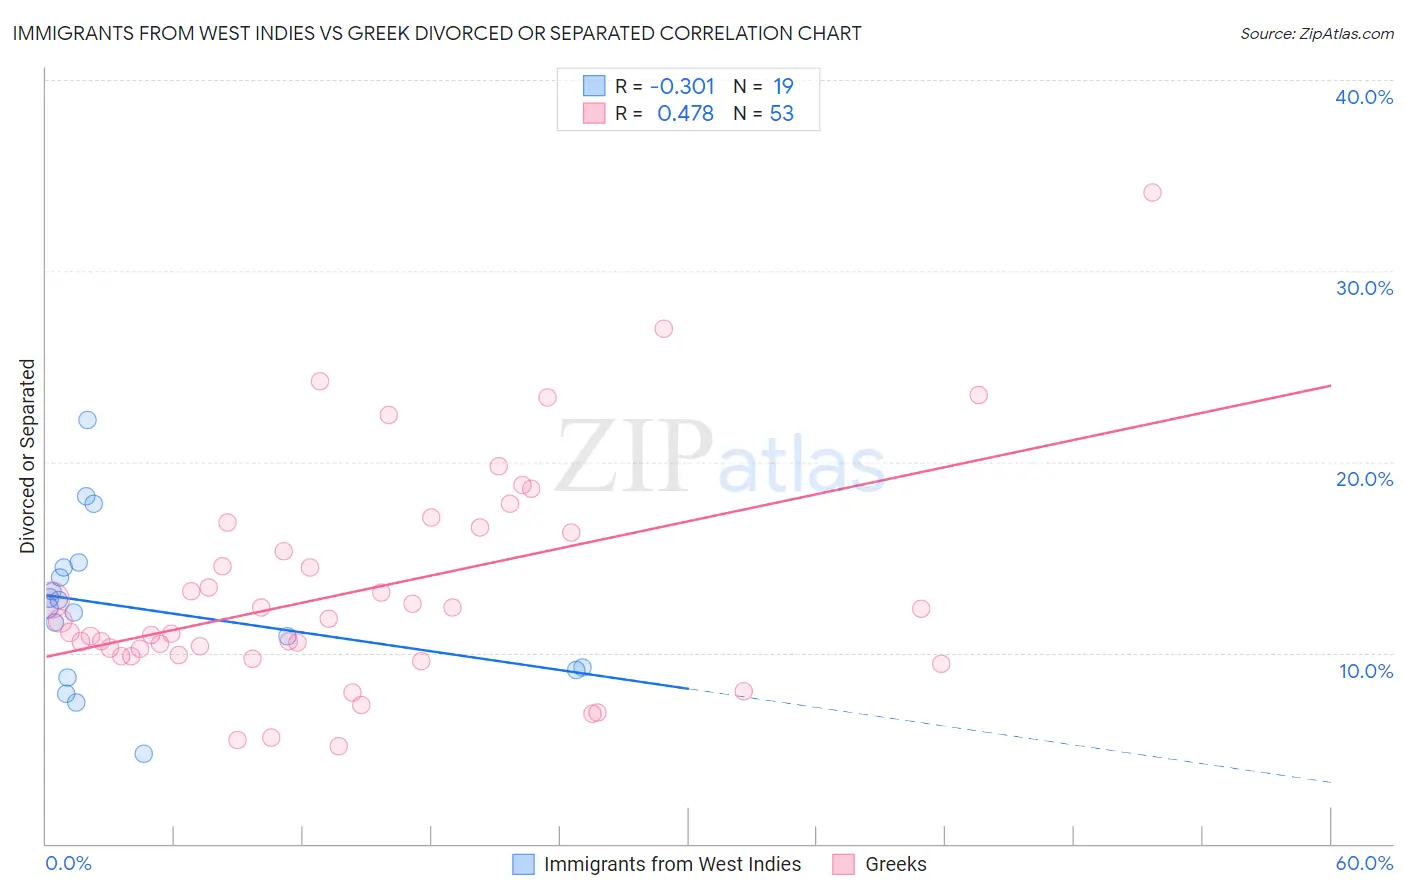
Immigrants from West Indies vs Greek Divorced or Separated Correlation Chart
The statistical analysis conducted on geographies consisting of 72,457,514 people shows a mild negative correlation between the proportion of Immigrants from West Indies and percentage of population currently divorced or separated in the United States with a correlation coefficient (R) of -0.301 and weighted average of 12.5%. Similarly, the statistical analysis conducted on geographies consisting of 482,480,692 people shows a moderate positive correlation between the proportion of Greeks and percentage of population currently divorced or separated in the United States with a correlation coefficient (R) of 0.478 and weighted average of 11.7%, a difference of 6.6%.
Divorced or Separated Correlation Summary
| Measurement | Immigrants from West Indies | Greek |
| Minimum | 4.7% | 5.1% |
| Maximum | 22.2% | 34.1% |
| Range | 17.5% | 29.0% |
| Mean | 12.3% | 13.3% |
| Median | 12.4% | 11.7% |
| Interquartile 25% (IQ1) | 9.1% | 9.9% |
| Interquartile 75% (IQ3) | 14.5% | 16.4% |
| Interquartile Range (IQR) | 5.4% | 6.6% |
| Standard Deviation (Sample) | 4.2% | 5.8% |
| Standard Deviation (Population) | 4.1% | 5.7% |
Similar Demographics by Divorced or Separated
Demographics Similar to Immigrants from West Indies by Divorced or Separated
In terms of divorced or separated, the demographic groups most similar to Immigrants from West Indies are Hispanic or Latino (12.5%, a difference of 0.020%), German (12.5%, a difference of 0.030%), Nepalese (12.5%, a difference of 0.060%), Finnish (12.5%, a difference of 0.070%), and Alaska Native (12.4%, a difference of 0.24%).
| Demographics | Rating | Rank | Divorced or Separated |
| Immigrants | Germany | 4.0 /100 | #239 | Tragic 12.4% |
| British West Indians | 3.7 /100 | #240 | Tragic 12.4% |
| Uruguayans | 3.4 /100 | #241 | Tragic 12.4% |
| Dutch | 3.1 /100 | #242 | Tragic 12.4% |
| Immigrants | Latin America | 2.8 /100 | #243 | Tragic 12.4% |
| Alaska Natives | 2.5 /100 | #244 | Tragic 12.4% |
| Hispanics or Latinos | 2.0 /100 | #245 | Tragic 12.5% |
| Immigrants | West Indies | 1.9 /100 | #246 | Tragic 12.5% |
| Germans | 1.8 /100 | #247 | Tragic 12.5% |
| Nepalese | 1.8 /100 | #248 | Tragic 12.5% |
| Finns | 1.8 /100 | #249 | Tragic 12.5% |
| Irish | 1.3 /100 | #250 | Tragic 12.5% |
| Aleuts | 1.3 /100 | #251 | Tragic 12.5% |
| Liberians | 0.9 /100 | #252 | Tragic 12.6% |
| Somalis | 0.9 /100 | #253 | Tragic 12.6% |
Demographics Similar to Greeks by Divorced or Separated
In terms of divorced or separated, the demographic groups most similar to Greeks are Immigrants from South Africa (11.7%, a difference of 0.010%), Immigrants from Czechoslovakia (11.7%, a difference of 0.010%), Immigrants from Spain (11.7%, a difference of 0.050%), Native Hawaiian (11.7%, a difference of 0.090%), and Immigrants from France (11.7%, a difference of 0.10%).
| Demographics | Rating | Rank | Divorced or Separated |
| Immigrants | Guyana | 98.5 /100 | #101 | Exceptional 11.6% |
| Immigrants | Croatia | 98.3 /100 | #102 | Exceptional 11.6% |
| Maltese | 98.2 /100 | #103 | Exceptional 11.6% |
| Salvadorans | 98.2 /100 | #104 | Exceptional 11.6% |
| Immigrants | El Salvador | 97.9 /100 | #105 | Exceptional 11.7% |
| Immigrants | Kazakhstan | 97.8 /100 | #106 | Exceptional 11.7% |
| Native Hawaiians | 97.2 /100 | #107 | Exceptional 11.7% |
| Greeks | 96.9 /100 | #108 | Exceptional 11.7% |
| Immigrants | South Africa | 96.9 /100 | #109 | Exceptional 11.7% |
| Immigrants | Czechoslovakia | 96.9 /100 | #110 | Exceptional 11.7% |
| Immigrants | Spain | 96.8 /100 | #111 | Exceptional 11.7% |
| Immigrants | France | 96.6 /100 | #112 | Exceptional 11.7% |
| Estonians | 96.6 /100 | #113 | Exceptional 11.7% |
| Immigrants | Norway | 95.9 /100 | #114 | Exceptional 11.7% |
| Lithuanians | 95.7 /100 | #115 | Exceptional 11.7% |