Croatian vs Greek Unemployment Among Ages 65 to 74 years
COMPARE
Croatian
Greek
Unemployment Among Ages 65 to 74 years
Unemployment Among Ages 65 to 74 years Comparison
Croatians
Greeks
5.1%
UNEMPLOYMENT AMONG AGES 65 TO 74 YEARS
99.5/ 100
METRIC RATING
57th/ 347
METRIC RANK
5.4%
UNEMPLOYMENT AMONG AGES 65 TO 74 YEARS
51.1/ 100
METRIC RATING
172nd/ 347
METRIC RANK
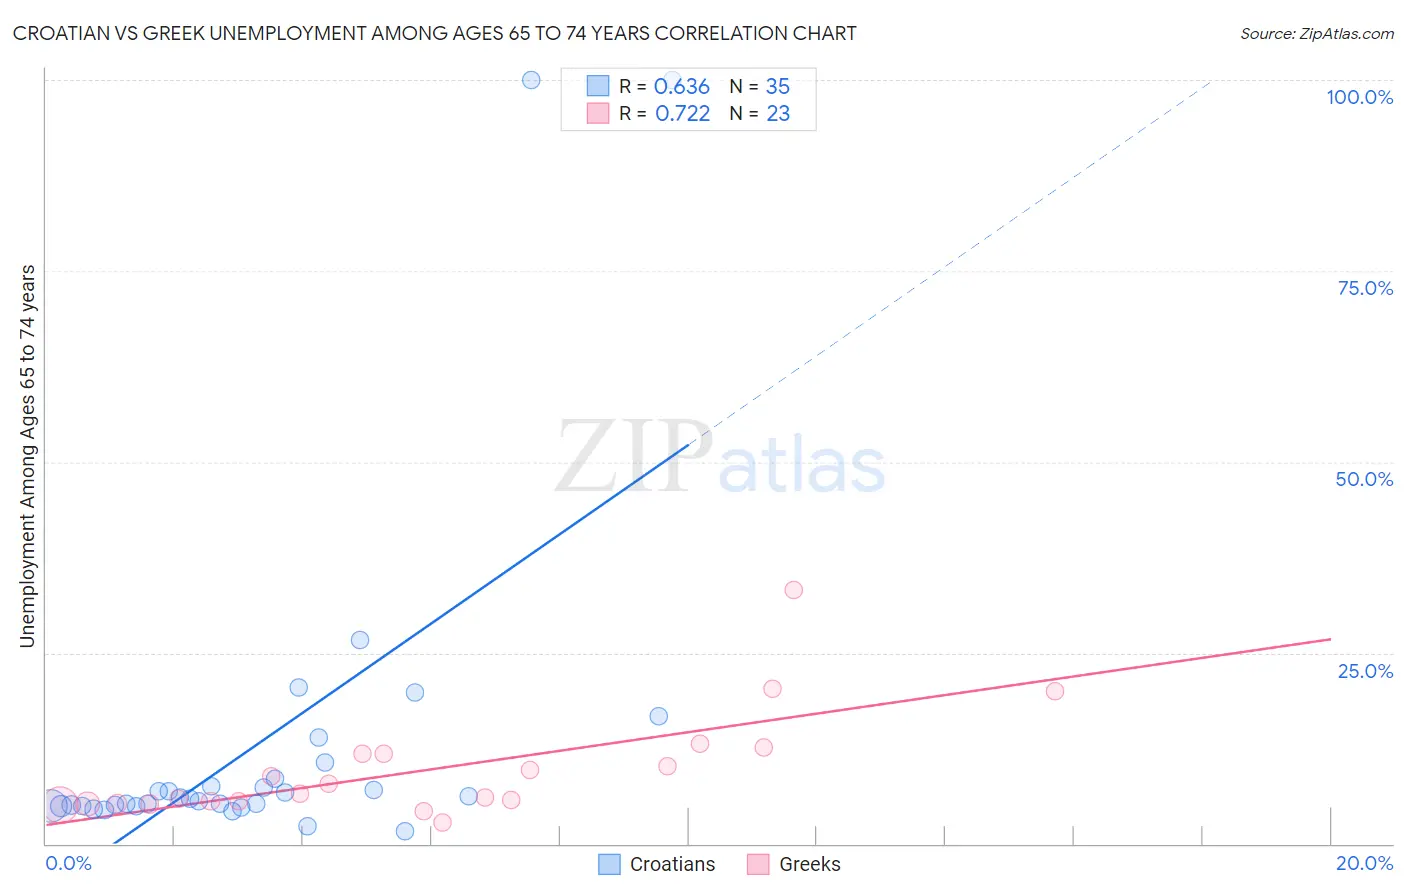
Croatian vs Greek Unemployment Among Ages 65 to 74 years Correlation Chart
The statistical analysis conducted on geographies consisting of 329,855,198 people shows a significant positive correlation between the proportion of Croatians and unemployment rate among population between the ages 65 and 74 in the United States with a correlation coefficient (R) of 0.636 and weighted average of 5.1%. Similarly, the statistical analysis conducted on geographies consisting of 406,284,460 people shows a strong positive correlation between the proportion of Greeks and unemployment rate among population between the ages 65 and 74 in the United States with a correlation coefficient (R) of 0.722 and weighted average of 5.4%, a difference of 4.6%.
Unemployment Among Ages 65 to 74 years Correlation Summary
| Measurement | Croatian | Greek |
| Minimum | 1.6% | 2.8% |
| Maximum | 100.0% | 33.3% |
| Range | 98.4% | 30.5% |
| Mean | 13.0% | 9.7% |
| Median | 5.8% | 6.6% |
| Interquartile 25% (IQ1) | 5.0% | 5.3% |
| Interquartile 75% (IQ3) | 8.5% | 11.9% |
| Interquartile Range (IQR) | 3.5% | 6.6% |
| Standard Deviation (Sample) | 22.4% | 6.9% |
| Standard Deviation (Population) | 22.1% | 6.8% |
Similar Demographics by Unemployment Among Ages 65 to 74 years
Demographics Similar to Croatians by Unemployment Among Ages 65 to 74 years
In terms of unemployment among ages 65 to 74 years, the demographic groups most similar to Croatians are Swedish (5.1%, a difference of 0.0%), German (5.1%, a difference of 0.050%), Carpatho Rusyn (5.1%, a difference of 0.080%), Immigrants from Bulgaria (5.1%, a difference of 0.10%), and Immigrants from Jordan (5.1%, a difference of 0.15%).
| Demographics | Rating | Rank | Unemployment Among Ages 65 to 74 years |
| Immigrants | Zimbabwe | 99.7 /100 | #50 | Exceptional 5.1% |
| Immigrants | Kazakhstan | 99.7 /100 | #51 | Exceptional 5.1% |
| Europeans | 99.6 /100 | #52 | Exceptional 5.1% |
| Immigrants | Ethiopia | 99.6 /100 | #53 | Exceptional 5.1% |
| Immigrants | Nicaragua | 99.6 /100 | #54 | Exceptional 5.1% |
| Carpatho Rusyns | 99.6 /100 | #55 | Exceptional 5.1% |
| Swedes | 99.5 /100 | #56 | Exceptional 5.1% |
| Croatians | 99.5 /100 | #57 | Exceptional 5.1% |
| Germans | 99.5 /100 | #58 | Exceptional 5.1% |
| Immigrants | Bulgaria | 99.4 /100 | #59 | Exceptional 5.1% |
| Immigrants | Jordan | 99.4 /100 | #60 | Exceptional 5.1% |
| Immigrants | Taiwan | 99.4 /100 | #61 | Exceptional 5.1% |
| Nicaraguans | 99.4 /100 | #62 | Exceptional 5.1% |
| Kiowa | 99.3 /100 | #63 | Exceptional 5.1% |
| Immigrants | Moldova | 99.3 /100 | #64 | Exceptional 5.1% |
Demographics Similar to Greeks by Unemployment Among Ages 65 to 74 years
In terms of unemployment among ages 65 to 74 years, the demographic groups most similar to Greeks are Immigrants from Northern Europe (5.4%, a difference of 0.0%), Panamanian (5.4%, a difference of 0.020%), Potawatomi (5.4%, a difference of 0.040%), Immigrants from Iran (5.4%, a difference of 0.070%), and Syrian (5.4%, a difference of 0.090%).
| Demographics | Rating | Rank | Unemployment Among Ages 65 to 74 years |
| Immigrants | Bosnia and Herzegovina | 60.2 /100 | #165 | Good 5.3% |
| Slovaks | 60.0 /100 | #166 | Good 5.3% |
| Indians (Asian) | 59.9 /100 | #167 | Average 5.3% |
| Whites/Caucasians | 57.2 /100 | #168 | Average 5.4% |
| Laotians | 55.7 /100 | #169 | Average 5.4% |
| Syrians | 53.7 /100 | #170 | Average 5.4% |
| Panamanians | 51.8 /100 | #171 | Average 5.4% |
| Greeks | 51.1 /100 | #172 | Average 5.4% |
| Immigrants | Northern Europe | 51.1 /100 | #173 | Average 5.4% |
| Potawatomi | 50.0 /100 | #174 | Average 5.4% |
| Immigrants | Iran | 49.0 /100 | #175 | Average 5.4% |
| Immigrants | Western Europe | 47.3 /100 | #176 | Average 5.4% |
| Arabs | 46.8 /100 | #177 | Average 5.4% |
| French | 43.1 /100 | #178 | Average 5.4% |
| Guamanians/Chamorros | 42.1 /100 | #179 | Average 5.4% |