Hopi vs Delaware Divorced or Separated
COMPARE
Hopi
Delaware
Divorced or Separated
Divorced or Separated Comparison
Hopi
Delaware
13.2%
DIVORCED OR SEPARATED
0.0/ 100
METRIC RATING
304th/ 347
METRIC RANK
12.7%
DIVORCED OR SEPARATED
0.1/ 100
METRIC RATING
283rd/ 347
METRIC RANK
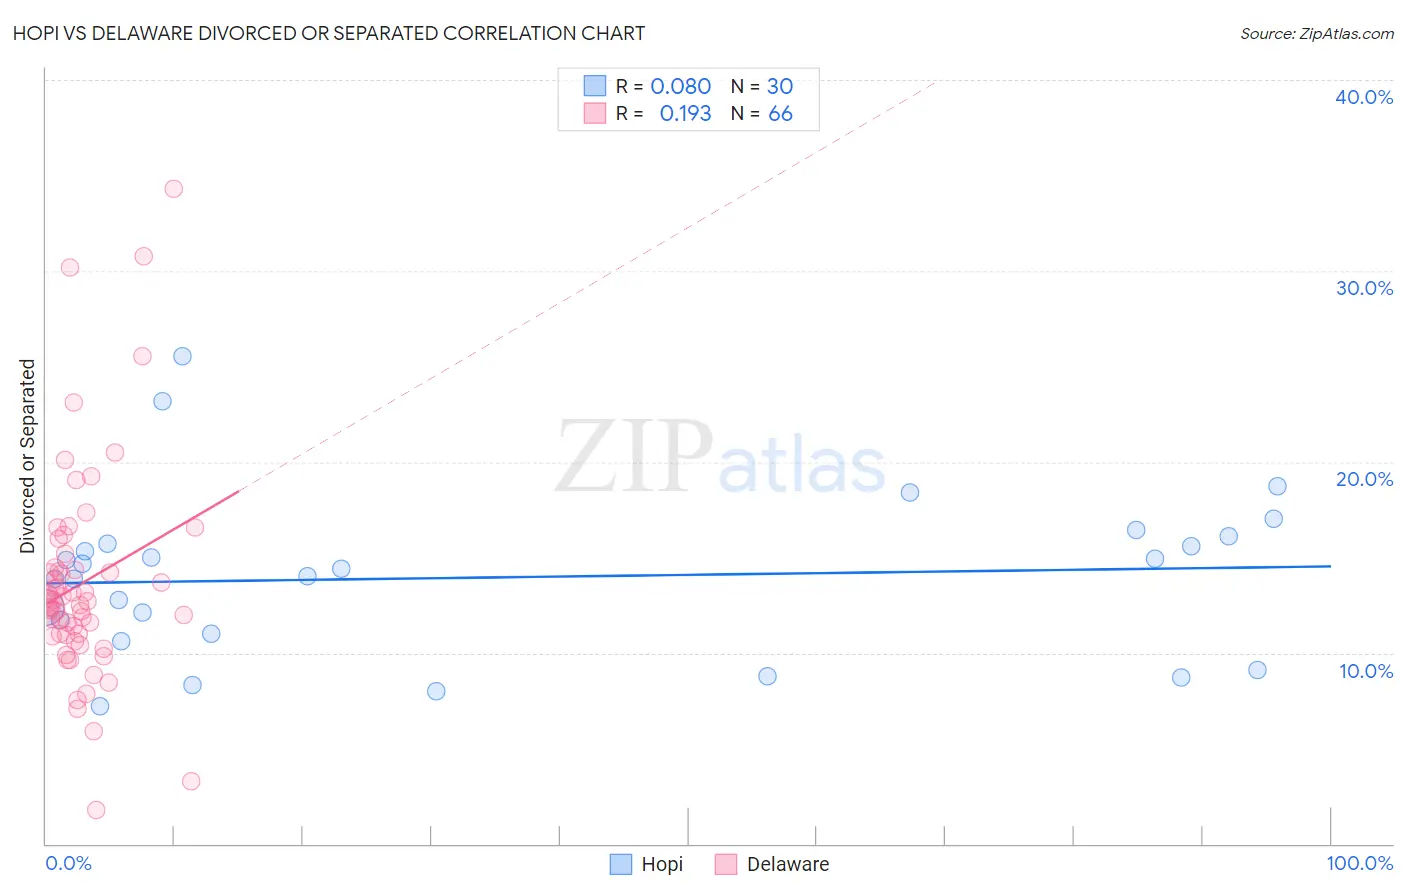
Hopi vs Delaware Divorced or Separated Correlation Chart
The statistical analysis conducted on geographies consisting of 74,740,168 people shows a slight positive correlation between the proportion of Hopi and percentage of population currently divorced or separated in the United States with a correlation coefficient (R) of 0.080 and weighted average of 13.2%. Similarly, the statistical analysis conducted on geographies consisting of 96,237,002 people shows a poor positive correlation between the proportion of Delaware and percentage of population currently divorced or separated in the United States with a correlation coefficient (R) of 0.193 and weighted average of 12.7%, a difference of 3.3%.
Divorced or Separated Correlation Summary
| Measurement | Hopi | Delaware |
| Minimum | 7.2% | 1.8% |
| Maximum | 25.5% | 34.3% |
| Range | 18.3% | 32.5% |
| Mean | 13.9% | 13.6% |
| Median | 14.2% | 12.6% |
| Interquartile 25% (IQ1) | 11.0% | 10.9% |
| Interquartile 75% (IQ3) | 15.7% | 14.5% |
| Interquartile Range (IQR) | 4.7% | 3.5% |
| Standard Deviation (Sample) | 4.2% | 5.6% |
| Standard Deviation (Population) | 4.1% | 5.6% |
Similar Demographics by Divorced or Separated
Demographics Similar to Hopi by Divorced or Separated
In terms of divorced or separated, the demographic groups most similar to Hopi are Chippewa (13.2%, a difference of 0.050%), Cape Verdean (13.1%, a difference of 0.13%), Immigrants from Venezuela (13.1%, a difference of 0.15%), Tlingit-Haida (13.2%, a difference of 0.22%), and Alaskan Athabascan (13.1%, a difference of 0.25%).
| Demographics | Rating | Rank | Divorced or Separated |
| Natives/Alaskans | 0.0 /100 | #297 | Tragic 13.0% |
| Venezuelans | 0.0 /100 | #298 | Tragic 13.0% |
| Immigrants | Jamaica | 0.0 /100 | #299 | Tragic 13.0% |
| Immigrants | Cabo Verde | 0.0 /100 | #300 | Tragic 13.1% |
| Alaskan Athabascans | 0.0 /100 | #301 | Tragic 13.1% |
| Immigrants | Venezuela | 0.0 /100 | #302 | Tragic 13.1% |
| Cape Verdeans | 0.0 /100 | #303 | Tragic 13.1% |
| Hopi | 0.0 /100 | #304 | Tragic 13.2% |
| Chippewa | 0.0 /100 | #305 | Tragic 13.2% |
| Tlingit-Haida | 0.0 /100 | #306 | Tragic 13.2% |
| French American Indians | 0.0 /100 | #307 | Tragic 13.2% |
| Ottawa | 0.0 /100 | #308 | Tragic 13.2% |
| Americans | 0.0 /100 | #309 | Tragic 13.2% |
| Africans | 0.0 /100 | #310 | Tragic 13.2% |
| Sioux | 0.0 /100 | #311 | Tragic 13.2% |
Demographics Similar to Delaware by Divorced or Separated
In terms of divorced or separated, the demographic groups most similar to Delaware are Subsaharan African (12.7%, a difference of 0.010%), Nonimmigrants (12.8%, a difference of 0.090%), Pueblo (12.7%, a difference of 0.13%), French (12.8%, a difference of 0.13%), and Immigrants from Zaire (12.7%, a difference of 0.17%).
| Demographics | Rating | Rank | Divorced or Separated |
| Spaniards | 0.2 /100 | #276 | Tragic 12.7% |
| Dominicans | 0.2 /100 | #277 | Tragic 12.7% |
| Lumbee | 0.2 /100 | #278 | Tragic 12.7% |
| Immigrants | Dominican Republic | 0.2 /100 | #279 | Tragic 12.7% |
| Immigrants | Zaire | 0.2 /100 | #280 | Tragic 12.7% |
| Pueblo | 0.2 /100 | #281 | Tragic 12.7% |
| Sub-Saharan Africans | 0.1 /100 | #282 | Tragic 12.7% |
| Delaware | 0.1 /100 | #283 | Tragic 12.7% |
| Immigrants | Nonimmigrants | 0.1 /100 | #284 | Tragic 12.8% |
| French | 0.1 /100 | #285 | Tragic 12.8% |
| Spanish | 0.1 /100 | #286 | Tragic 12.8% |
| Hondurans | 0.1 /100 | #287 | Tragic 12.8% |
| French Canadians | 0.1 /100 | #288 | Tragic 12.8% |
| Iroquois | 0.0 /100 | #289 | Tragic 12.9% |
| Pima | 0.0 /100 | #290 | Tragic 12.9% |