Guamanian/Chamorro vs Delaware Divorced or Separated
COMPARE
Guamanian/Chamorro
Delaware
Divorced or Separated
Divorced or Separated Comparison
Guamanians/Chamorros
Delaware
12.3%
DIVORCED OR SEPARATED
11.3/ 100
METRIC RATING
221st/ 347
METRIC RANK
12.7%
DIVORCED OR SEPARATED
0.1/ 100
METRIC RATING
283rd/ 347
METRIC RANK
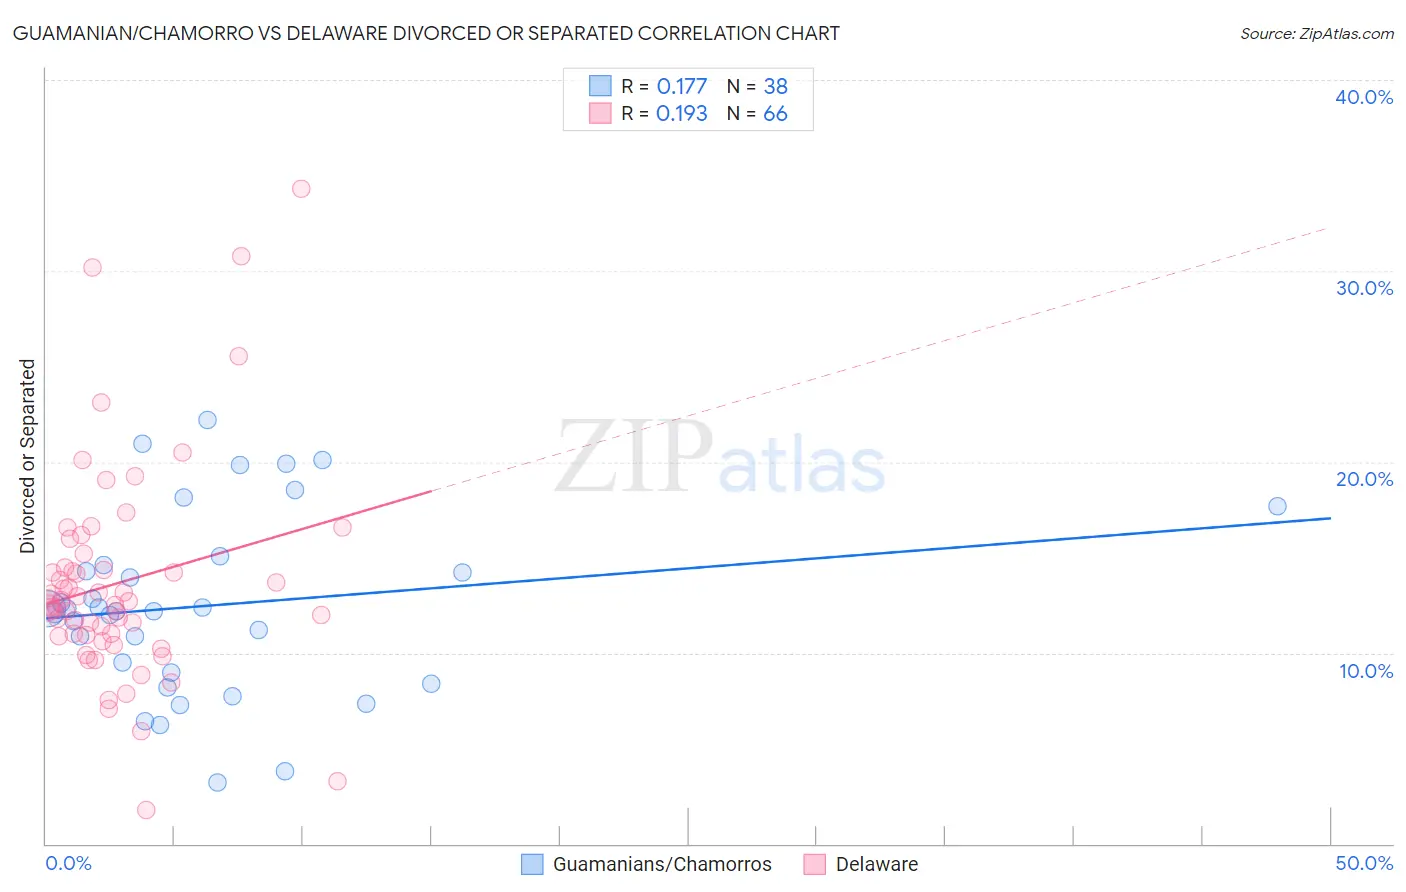
Guamanian/Chamorro vs Delaware Divorced or Separated Correlation Chart
The statistical analysis conducted on geographies consisting of 221,943,719 people shows a poor positive correlation between the proportion of Guamanians/Chamorros and percentage of population currently divorced or separated in the United States with a correlation coefficient (R) of 0.177 and weighted average of 12.3%. Similarly, the statistical analysis conducted on geographies consisting of 96,237,002 people shows a poor positive correlation between the proportion of Delaware and percentage of population currently divorced or separated in the United States with a correlation coefficient (R) of 0.193 and weighted average of 12.7%, a difference of 3.8%.
Divorced or Separated Correlation Summary
| Measurement | Guamanian/Chamorro | Delaware |
| Minimum | 3.2% | 1.8% |
| Maximum | 22.2% | 34.3% |
| Range | 19.0% | 32.5% |
| Mean | 12.5% | 13.6% |
| Median | 12.2% | 12.6% |
| Interquartile 25% (IQ1) | 9.0% | 10.9% |
| Interquartile 75% (IQ3) | 14.6% | 14.5% |
| Interquartile Range (IQR) | 5.6% | 3.5% |
| Standard Deviation (Sample) | 4.7% | 5.6% |
| Standard Deviation (Population) | 4.7% | 5.6% |
Similar Demographics by Divorced or Separated
Demographics Similar to Guamanians/Chamorros by Divorced or Separated
In terms of divorced or separated, the demographic groups most similar to Guamanians/Chamorros are Czechoslovakian (12.3%, a difference of 0.030%), British (12.3%, a difference of 0.030%), Bangladeshi (12.3%, a difference of 0.070%), Scandinavian (12.3%, a difference of 0.080%), and Slovene (12.3%, a difference of 0.15%).
| Demographics | Rating | Rank | Divorced or Separated |
| Immigrants | Argentina | 15.5 /100 | #214 | Poor 12.2% |
| Europeans | 15.4 /100 | #215 | Poor 12.2% |
| Immigrants | South America | 15.4 /100 | #216 | Poor 12.2% |
| Northern Europeans | 14.7 /100 | #217 | Poor 12.2% |
| Slovenes | 13.2 /100 | #218 | Poor 12.3% |
| Czechoslovakians | 11.7 /100 | #219 | Poor 12.3% |
| British | 11.6 /100 | #220 | Poor 12.3% |
| Guamanians/Chamorros | 11.3 /100 | #221 | Poor 12.3% |
| Bangladeshis | 10.5 /100 | #222 | Poor 12.3% |
| Scandinavians | 10.4 /100 | #223 | Poor 12.3% |
| Immigrants | Azores | 9.7 /100 | #224 | Tragic 12.3% |
| Belgians | 9.7 /100 | #225 | Tragic 12.3% |
| Immigrants | Western Africa | 9.3 /100 | #226 | Tragic 12.3% |
| Hmong | 8.8 /100 | #227 | Tragic 12.3% |
| Immigrants | Cameroon | 8.3 /100 | #228 | Tragic 12.3% |
Demographics Similar to Delaware by Divorced or Separated
In terms of divorced or separated, the demographic groups most similar to Delaware are Subsaharan African (12.7%, a difference of 0.010%), Nonimmigrants (12.8%, a difference of 0.090%), Pueblo (12.7%, a difference of 0.13%), French (12.8%, a difference of 0.13%), and Immigrants from Zaire (12.7%, a difference of 0.17%).
| Demographics | Rating | Rank | Divorced or Separated |
| Spaniards | 0.2 /100 | #276 | Tragic 12.7% |
| Dominicans | 0.2 /100 | #277 | Tragic 12.7% |
| Lumbee | 0.2 /100 | #278 | Tragic 12.7% |
| Immigrants | Dominican Republic | 0.2 /100 | #279 | Tragic 12.7% |
| Immigrants | Zaire | 0.2 /100 | #280 | Tragic 12.7% |
| Pueblo | 0.2 /100 | #281 | Tragic 12.7% |
| Sub-Saharan Africans | 0.1 /100 | #282 | Tragic 12.7% |
| Delaware | 0.1 /100 | #283 | Tragic 12.7% |
| Immigrants | Nonimmigrants | 0.1 /100 | #284 | Tragic 12.8% |
| French | 0.1 /100 | #285 | Tragic 12.8% |
| Spanish | 0.1 /100 | #286 | Tragic 12.8% |
| Hondurans | 0.1 /100 | #287 | Tragic 12.8% |
| French Canadians | 0.1 /100 | #288 | Tragic 12.8% |
| Iroquois | 0.0 /100 | #289 | Tragic 12.9% |
| Pima | 0.0 /100 | #290 | Tragic 12.9% |