Cape Verdean vs Immigrants from Southern Europe Family Households
COMPARE
Cape Verdean
Immigrants from Southern Europe
Family Households
Family Households Comparison
Cape Verdeans
Immigrants from Southern Europe
61.8%
FAMILY HOUSEHOLDS
0.0/ 100
METRIC RATING
319th/ 347
METRIC RANK
64.4%
FAMILY HOUSEHOLDS
60.0/ 100
METRIC RATING
165th/ 347
METRIC RANK
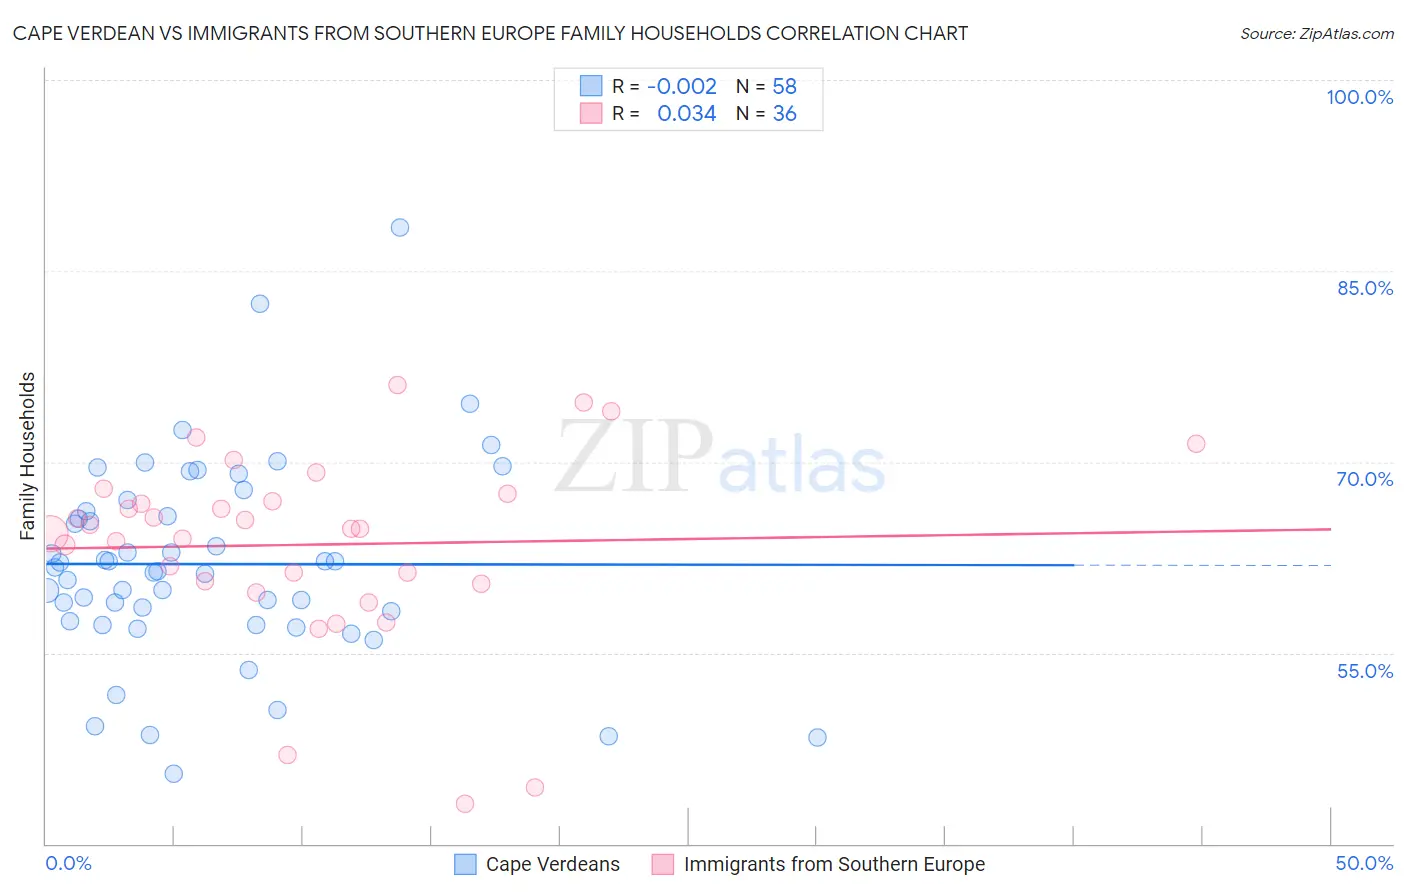
Cape Verdean vs Immigrants from Southern Europe Family Households Correlation Chart
The statistical analysis conducted on geographies consisting of 107,550,283 people shows no correlation between the proportion of Cape Verdeans and percentage of family households in the United States with a correlation coefficient (R) of -0.002 and weighted average of 61.8%. Similarly, the statistical analysis conducted on geographies consisting of 402,628,805 people shows no correlation between the proportion of Immigrants from Southern Europe and percentage of family households in the United States with a correlation coefficient (R) of 0.034 and weighted average of 64.4%, a difference of 4.2%.
Family Households Correlation Summary
| Measurement | Cape Verdean | Immigrants from Southern Europe |
| Minimum | 45.5% | 43.1% |
| Maximum | 88.4% | 76.0% |
| Range | 42.9% | 32.9% |
| Mean | 62.0% | 63.5% |
| Median | 61.5% | 64.7% |
| Interquartile 25% (IQ1) | 57.5% | 60.5% |
| Interquartile 75% (IQ3) | 66.1% | 67.2% |
| Interquartile Range (IQR) | 8.6% | 6.7% |
| Standard Deviation (Sample) | 7.9% | 7.4% |
| Standard Deviation (Population) | 7.8% | 7.3% |
Similar Demographics by Family Households
Demographics Similar to Cape Verdeans by Family Households
In terms of family households, the demographic groups most similar to Cape Verdeans are Alaskan Athabascan (61.8%, a difference of 0.060%), Ugandan (61.7%, a difference of 0.12%), Immigrants from Bosnia and Herzegovina (61.9%, a difference of 0.14%), Alsatian (61.7%, a difference of 0.17%), and Immigrants from Middle Africa (61.9%, a difference of 0.18%).
| Demographics | Rating | Rank | Family Households |
| Immigrants | Latvia | 0.0 /100 | #312 | Tragic 62.0% |
| Liberians | 0.0 /100 | #313 | Tragic 62.0% |
| Immigrants | Cabo Verde | 0.0 /100 | #314 | Tragic 61.9% |
| Moroccans | 0.0 /100 | #315 | Tragic 61.9% |
| Immigrants | Middle Africa | 0.0 /100 | #316 | Tragic 61.9% |
| Immigrants | Bosnia and Herzegovina | 0.0 /100 | #317 | Tragic 61.9% |
| Alaskan Athabascans | 0.0 /100 | #318 | Tragic 61.8% |
| Cape Verdeans | 0.0 /100 | #319 | Tragic 61.8% |
| Ugandans | 0.0 /100 | #320 | Tragic 61.7% |
| Alsatians | 0.0 /100 | #321 | Tragic 61.7% |
| Immigrants | Serbia | 0.0 /100 | #322 | Tragic 61.6% |
| Tlingit-Haida | 0.0 /100 | #323 | Tragic 61.6% |
| Immigrants | West Indies | 0.0 /100 | #324 | Tragic 61.6% |
| Immigrants | Switzerland | 0.0 /100 | #325 | Tragic 61.6% |
| Indonesians | 0.0 /100 | #326 | Tragic 61.5% |
Demographics Similar to Immigrants from Southern Europe by Family Households
In terms of family households, the demographic groups most similar to Immigrants from Southern Europe are Immigrants from Nigeria (64.4%, a difference of 0.0%), Scotch-Irish (64.4%, a difference of 0.010%), British (64.4%, a difference of 0.020%), Chickasaw (64.4%, a difference of 0.020%), and Irish (64.4%, a difference of 0.030%).
| Demographics | Rating | Rank | Family Households |
| Lebanese | 66.4 /100 | #158 | Good 64.4% |
| Germans | 65.8 /100 | #159 | Good 64.4% |
| Immigrants | Moldova | 65.2 /100 | #160 | Good 64.4% |
| Immigrants | England | 62.6 /100 | #161 | Good 64.4% |
| British | 61.6 /100 | #162 | Good 64.4% |
| Chickasaw | 61.5 /100 | #163 | Good 64.4% |
| Immigrants | Nigeria | 60.1 /100 | #164 | Good 64.4% |
| Immigrants | Southern Europe | 60.0 /100 | #165 | Good 64.4% |
| Scotch-Irish | 59.2 /100 | #166 | Average 64.4% |
| Irish | 57.9 /100 | #167 | Average 64.4% |
| Hondurans | 57.5 /100 | #168 | Average 64.4% |
| Iraqis | 56.0 /100 | #169 | Average 64.4% |
| Armenians | 55.9 /100 | #170 | Average 64.4% |
| Ute | 54.6 /100 | #171 | Average 64.3% |
| Dutch West Indians | 53.9 /100 | #172 | Average 64.3% |