Creek vs Immigrants from Southern Europe Female Poverty
COMPARE
Creek
Immigrants from Southern Europe
Female Poverty
Female Poverty Comparison
Creek
Immigrants from Southern Europe
17.0%
FEMALE POVERTY
0.0/ 100
METRIC RATING
310th/ 347
METRIC RANK
12.7%
FEMALE POVERTY
90.9/ 100
METRIC RATING
117th/ 347
METRIC RANK
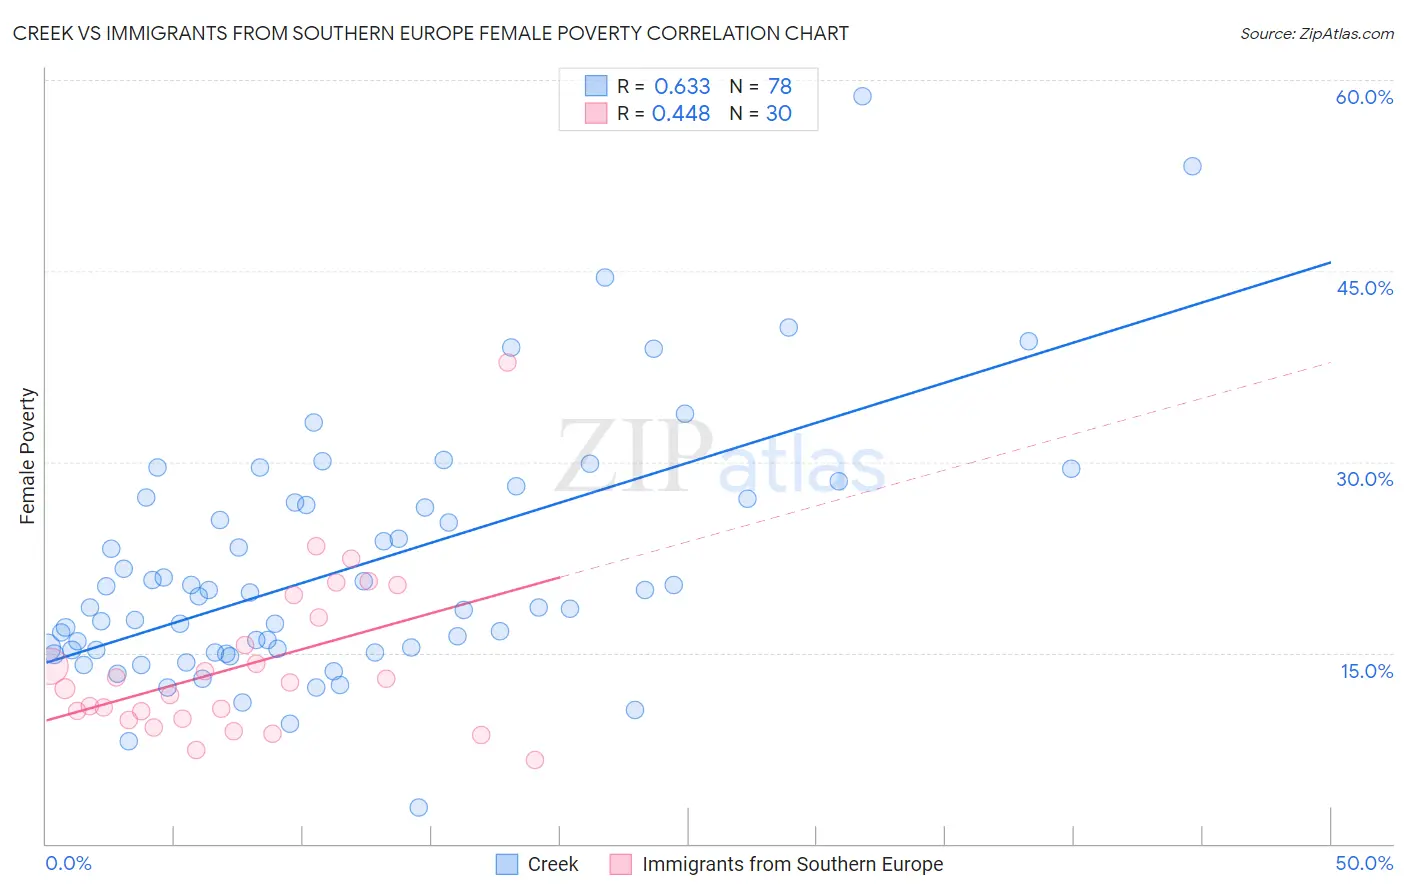
Creek vs Immigrants from Southern Europe Female Poverty Correlation Chart
The statistical analysis conducted on geographies consisting of 178,438,059 people shows a significant positive correlation between the proportion of Creek and poverty level among females in the United States with a correlation coefficient (R) of 0.633 and weighted average of 17.0%. Similarly, the statistical analysis conducted on geographies consisting of 402,507,069 people shows a moderate positive correlation between the proportion of Immigrants from Southern Europe and poverty level among females in the United States with a correlation coefficient (R) of 0.448 and weighted average of 12.7%, a difference of 33.9%.
Female Poverty Correlation Summary
| Measurement | Creek | Immigrants from Southern Europe |
| Minimum | 2.9% | 6.6% |
| Maximum | 58.7% | 37.8% |
| Range | 55.8% | 31.3% |
| Mean | 21.7% | 14.1% |
| Median | 19.0% | 12.4% |
| Interquartile 25% (IQ1) | 15.3% | 9.8% |
| Interquartile 75% (IQ3) | 26.8% | 17.8% |
| Interquartile Range (IQR) | 11.5% | 8.0% |
| Standard Deviation (Sample) | 9.8% | 6.5% |
| Standard Deviation (Population) | 9.8% | 6.4% |
Similar Demographics by Female Poverty
Demographics Similar to Creek by Female Poverty
In terms of female poverty, the demographic groups most similar to Creek are Immigrants from Guatemala (17.0%, a difference of 0.0%), Immigrants from Somalia (17.0%, a difference of 0.10%), British West Indian (17.0%, a difference of 0.17%), Immigrants from Mexico (17.0%, a difference of 0.24%), and Dutch West Indian (17.1%, a difference of 0.42%).
| Demographics | Rating | Rank | Female Poverty |
| Choctaw | 0.0 /100 | #303 | Tragic 16.8% |
| Immigrants | Central America | 0.0 /100 | #304 | Tragic 16.8% |
| Immigrants | Grenada | 0.0 /100 | #305 | Tragic 16.8% |
| Immigrants | Caribbean | 0.0 /100 | #306 | Tragic 16.9% |
| Seminole | 0.0 /100 | #307 | Tragic 16.9% |
| Africans | 0.0 /100 | #308 | Tragic 16.9% |
| Immigrants | Mexico | 0.0 /100 | #309 | Tragic 17.0% |
| Creek | 0.0 /100 | #310 | Tragic 17.0% |
| Immigrants | Guatemala | 0.0 /100 | #311 | Tragic 17.0% |
| Immigrants | Somalia | 0.0 /100 | #312 | Tragic 17.0% |
| British West Indians | 0.0 /100 | #313 | Tragic 17.0% |
| Dutch West Indians | 0.0 /100 | #314 | Tragic 17.1% |
| U.S. Virgin Islanders | 0.0 /100 | #315 | Tragic 17.3% |
| Hondurans | 0.0 /100 | #316 | Tragic 17.4% |
| Immigrants | Congo | 0.0 /100 | #317 | Tragic 17.4% |
Demographics Similar to Immigrants from Southern Europe by Female Poverty
In terms of female poverty, the demographic groups most similar to Immigrants from Southern Europe are Sri Lankan (12.7%, a difference of 0.020%), Albanian (12.7%, a difference of 0.030%), Immigrants from Russia (12.7%, a difference of 0.070%), New Zealander (12.7%, a difference of 0.090%), and Immigrants from Hungary (12.7%, a difference of 0.19%).
| Demographics | Rating | Rank | Female Poverty |
| Paraguayans | 93.0 /100 | #110 | Exceptional 12.6% |
| Soviet Union | 92.4 /100 | #111 | Exceptional 12.6% |
| Immigrants | Israel | 92.0 /100 | #112 | Exceptional 12.6% |
| Canadians | 92.0 /100 | #113 | Exceptional 12.7% |
| Welsh | 91.6 /100 | #114 | Exceptional 12.7% |
| Puget Sound Salish | 91.5 /100 | #115 | Exceptional 12.7% |
| Immigrants | Russia | 91.2 /100 | #116 | Exceptional 12.7% |
| Immigrants | Southern Europe | 90.9 /100 | #117 | Exceptional 12.7% |
| Sri Lankans | 90.9 /100 | #118 | Exceptional 12.7% |
| Albanians | 90.8 /100 | #119 | Exceptional 12.7% |
| New Zealanders | 90.6 /100 | #120 | Exceptional 12.7% |
| Immigrants | Hungary | 90.3 /100 | #121 | Exceptional 12.7% |
| French Canadians | 90.2 /100 | #122 | Exceptional 12.7% |
| Immigrants | South Eastern Asia | 89.9 /100 | #123 | Excellent 12.7% |
| Immigrants | Norway | 89.3 /100 | #124 | Excellent 12.8% |