Cree vs Immigrants from Brazil In Labor Force | Age 20-24
COMPARE
Cree
Immigrants from Brazil
In Labor Force | Age 20-24
In Labor Force | Age 20-24 Comparison
Cree
Immigrants from Brazil
76.6%
IN LABOR FORCE | AGE 20-24
99.7/ 100
METRIC RATING
74th/ 347
METRIC RANK
75.5%
IN LABOR FORCE | AGE 20-24
84.8/ 100
METRIC RATING
136th/ 347
METRIC RANK
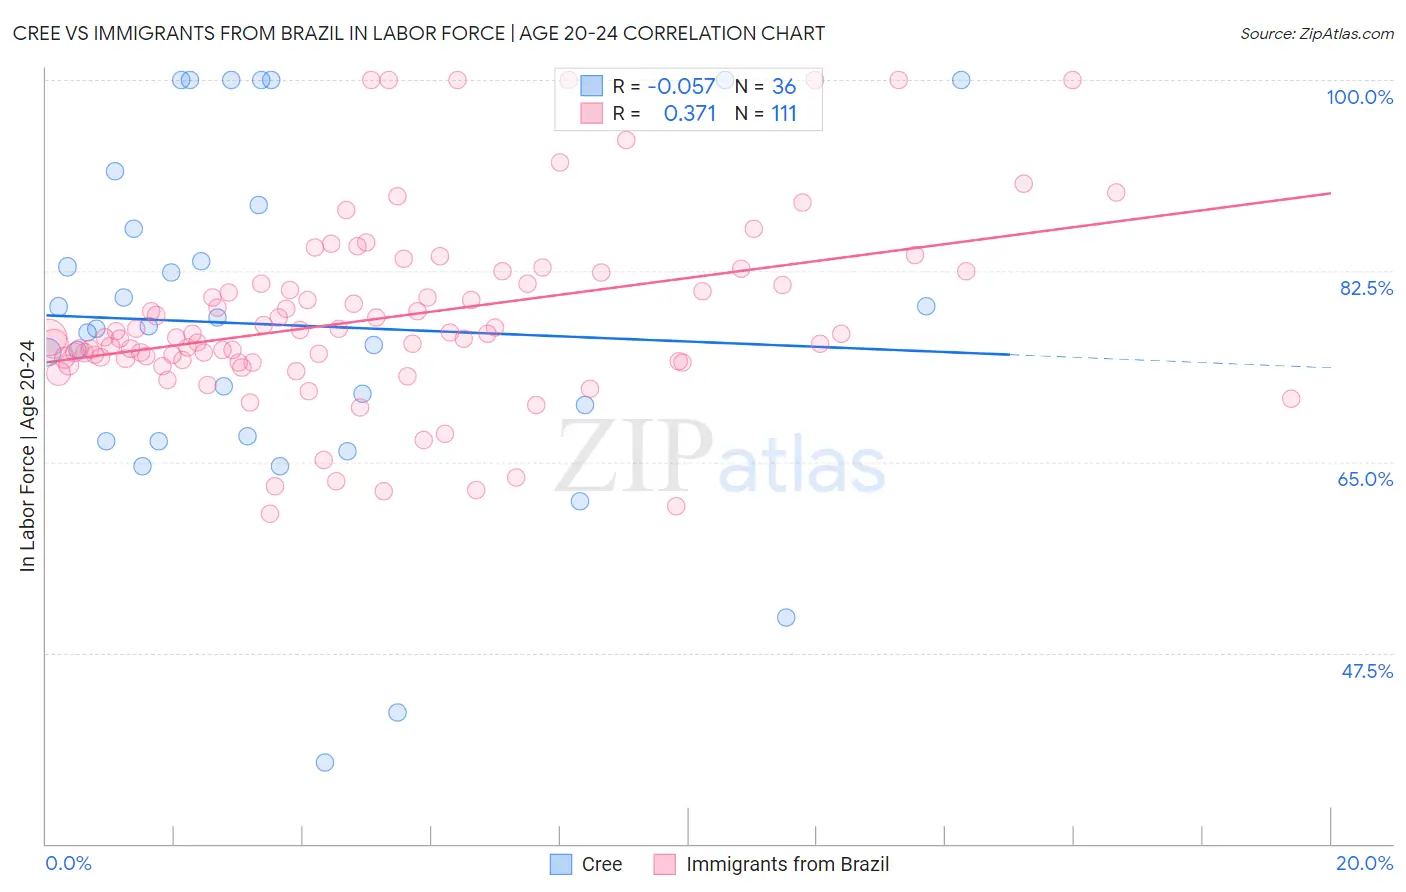
Cree vs Immigrants from Brazil In Labor Force | Age 20-24 Correlation Chart
The statistical analysis conducted on geographies consisting of 76,182,817 people shows a slight negative correlation between the proportion of Cree and labor force participation rate among population between the ages 20 and 24 in the United States with a correlation coefficient (R) of -0.057 and weighted average of 76.6%. Similarly, the statistical analysis conducted on geographies consisting of 342,949,141 people shows a mild positive correlation between the proportion of Immigrants from Brazil and labor force participation rate among population between the ages 20 and 24 in the United States with a correlation coefficient (R) of 0.371 and weighted average of 75.5%, a difference of 1.5%.
In Labor Force | Age 20-24 Correlation Summary
| Measurement | Cree | Immigrants from Brazil |
| Minimum | 37.5% | 60.3% |
| Maximum | 100.0% | 100.0% |
| Range | 62.5% | 39.7% |
| Mean | 77.5% | 78.2% |
| Median | 77.3% | 76.4% |
| Interquartile 25% (IQ1) | 67.1% | 74.2% |
| Interquartile 75% (IQ3) | 87.4% | 81.3% |
| Interquartile Range (IQR) | 20.4% | 7.1% |
| Standard Deviation (Sample) | 15.9% | 8.5% |
| Standard Deviation (Population) | 15.6% | 8.5% |
Similar Demographics by In Labor Force | Age 20-24
Demographics Similar to Cree by In Labor Force | Age 20-24
In terms of in labor force | age 20-24, the demographic groups most similar to Cree are Immigrants from Middle Africa (76.6%, a difference of 0.020%), Immigrants from Moldova (76.6%, a difference of 0.060%), British (76.7%, a difference of 0.070%), Immigrants from Cameroon (76.6%, a difference of 0.090%), and Canadian (76.6%, a difference of 0.090%).
| Demographics | Rating | Rank | In Labor Force | Age 20-24 |
| Slavs | 99.9 /100 | #67 | Exceptional 76.9% |
| French American Indians | 99.8 /100 | #68 | Exceptional 76.8% |
| Immigrants | Sudan | 99.8 /100 | #69 | Exceptional 76.8% |
| Ottawa | 99.8 /100 | #70 | Exceptional 76.8% |
| Northern Europeans | 99.8 /100 | #71 | Exceptional 76.8% |
| Guamanians/Chamorros | 99.8 /100 | #72 | Exceptional 76.7% |
| British | 99.8 /100 | #73 | Exceptional 76.7% |
| Cree | 99.7 /100 | #74 | Exceptional 76.6% |
| Immigrants | Middle Africa | 99.7 /100 | #75 | Exceptional 76.6% |
| Immigrants | Moldova | 99.6 /100 | #76 | Exceptional 76.6% |
| Immigrants | Cameroon | 99.6 /100 | #77 | Exceptional 76.6% |
| Canadians | 99.6 /100 | #78 | Exceptional 76.6% |
| Immigrants | Zaire | 99.6 /100 | #79 | Exceptional 76.6% |
| Italians | 99.6 /100 | #80 | Exceptional 76.5% |
| Basques | 99.5 /100 | #81 | Exceptional 76.5% |
Demographics Similar to Immigrants from Brazil by In Labor Force | Age 20-24
In terms of in labor force | age 20-24, the demographic groups most similar to Immigrants from Brazil are Jordanian (75.5%, a difference of 0.0%), Australian (75.5%, a difference of 0.0%), Immigrants from England (75.5%, a difference of 0.010%), Delaware (75.5%, a difference of 0.010%), and Yaqui (75.5%, a difference of 0.020%).
| Demographics | Rating | Rank | In Labor Force | Age 20-24 |
| Iroquois | 89.1 /100 | #129 | Excellent 75.6% |
| Immigrants | Austria | 88.8 /100 | #130 | Excellent 75.6% |
| Immigrants | Jordan | 88.5 /100 | #131 | Excellent 75.6% |
| Palestinians | 88.4 /100 | #132 | Excellent 75.6% |
| Zimbabweans | 88.2 /100 | #133 | Excellent 75.6% |
| Estonians | 87.1 /100 | #134 | Excellent 75.6% |
| Yaqui | 85.5 /100 | #135 | Excellent 75.5% |
| Immigrants | Brazil | 84.8 /100 | #136 | Excellent 75.5% |
| Jordanians | 84.8 /100 | #137 | Excellent 75.5% |
| Australians | 84.8 /100 | #138 | Excellent 75.5% |
| Immigrants | England | 84.6 /100 | #139 | Excellent 75.5% |
| Delaware | 84.5 /100 | #140 | Excellent 75.5% |
| Romanians | 84.1 /100 | #141 | Excellent 75.5% |
| Blackfeet | 83.6 /100 | #142 | Excellent 75.5% |
| Spaniards | 82.0 /100 | #143 | Excellent 75.5% |