Costa Rican vs Slovak Householder Income Ages 45 - 64 years
COMPARE
Costa Rican
Slovak
Householder Income Ages 45 - 64 years
Householder Income Ages 45 - 64 years Comparison
Costa Ricans
Slovaks
$102,779
HOUSEHOLDER INCOME AGES 45 - 64 YEARS
77.4/ 100
METRIC RATING
155th/ 347
METRIC RANK
$101,029
HOUSEHOLDER INCOME AGES 45 - 64 YEARS
58.8/ 100
METRIC RATING
170th/ 347
METRIC RANK
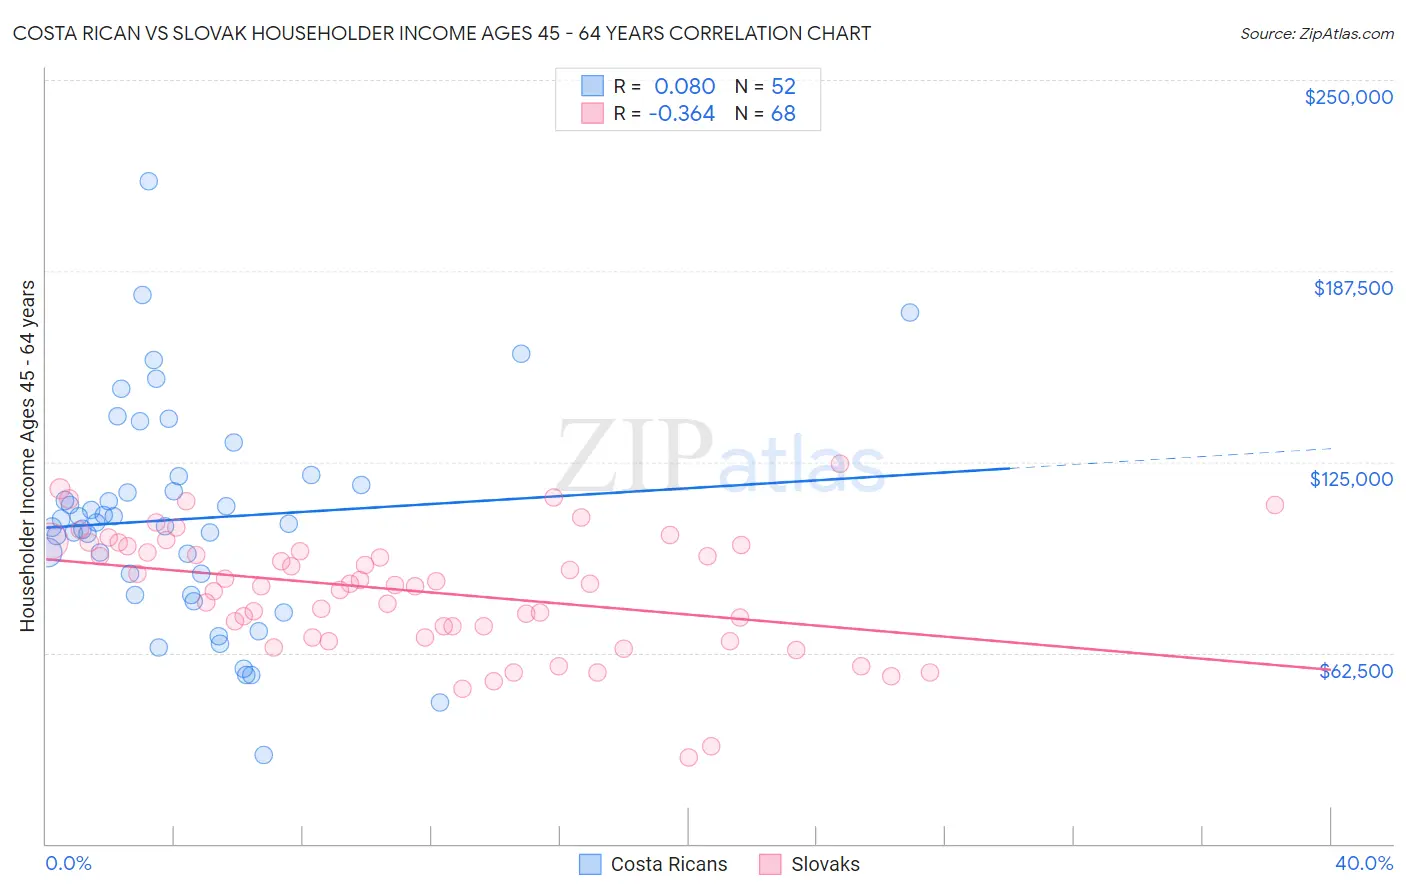
Costa Rican vs Slovak Householder Income Ages 45 - 64 years Correlation Chart
The statistical analysis conducted on geographies consisting of 253,341,339 people shows a slight positive correlation between the proportion of Costa Ricans and household income with householder between the ages 45 and 64 in the United States with a correlation coefficient (R) of 0.080 and weighted average of $102,779. Similarly, the statistical analysis conducted on geographies consisting of 397,139,632 people shows a mild negative correlation between the proportion of Slovaks and household income with householder between the ages 45 and 64 in the United States with a correlation coefficient (R) of -0.364 and weighted average of $101,029, a difference of 1.7%.
Householder Income Ages 45 - 64 years Correlation Summary
| Measurement | Costa Rican | Slovak |
| Minimum | $28,864 | $28,125 |
| Maximum | $217,009 | $124,318 |
| Range | $188,145 | $96,193 |
| Mean | $106,317 | $82,752 |
| Median | $104,965 | $84,870 |
| Interquartile 25% (IQ1) | $84,873 | $69,341 |
| Interquartile 75% (IQ3) | $118,891 | $97,616 |
| Interquartile Range (IQR) | $34,017 | $28,275 |
| Standard Deviation (Sample) | $35,393 | $19,751 |
| Standard Deviation (Population) | $35,051 | $19,605 |
Demographics Similar to Costa Ricans and Slovaks by Householder Income Ages 45 - 64 years
In terms of householder income ages 45 - 64 years, the demographic groups most similar to Costa Ricans are Carpatho Rusyn ($102,777, a difference of 0.0%), Immigrants from Ethiopia ($102,763, a difference of 0.020%), Slovene ($102,885, a difference of 0.10%), Slavic ($102,629, a difference of 0.15%), and Scandinavian ($102,969, a difference of 0.19%). Similarly, the demographic groups most similar to Slovaks are South American Indian ($101,171, a difference of 0.14%), Guamanian/Chamorro ($101,170, a difference of 0.14%), South American ($100,837, a difference of 0.19%), Czechoslovakian ($101,387, a difference of 0.35%), and Immigrants from Uzbekistan ($100,523, a difference of 0.50%).
| Demographics | Rating | Rank | Householder Income Ages 45 - 64 years |
| Irish | 79.8 /100 | #152 | Good $103,067 |
| Scandinavians | 79.0 /100 | #153 | Good $102,969 |
| Slovenes | 78.3 /100 | #154 | Good $102,885 |
| Costa Ricans | 77.4 /100 | #155 | Good $102,779 |
| Carpatho Rusyns | 77.4 /100 | #156 | Good $102,777 |
| Immigrants | Ethiopia | 77.3 /100 | #157 | Good $102,763 |
| Slavs | 76.1 /100 | #158 | Good $102,629 |
| Sierra Leoneans | 74.2 /100 | #159 | Good $102,427 |
| Icelanders | 72.5 /100 | #160 | Good $102,261 |
| Immigrants | Nepal | 71.8 /100 | #161 | Good $102,190 |
| Scottish | 71.1 /100 | #162 | Good $102,123 |
| English | 70.1 /100 | #163 | Good $102,021 |
| Immigrants | Morocco | 70.0 /100 | #164 | Good $102,015 |
| Immigrants | Albania | 69.4 /100 | #165 | Good $101,957 |
| Samoans | 65.3 /100 | #166 | Good $101,580 |
| Czechoslovakians | 63.0 /100 | #167 | Good $101,387 |
| South American Indians | 60.5 /100 | #168 | Good $101,171 |
| Guamanians/Chamorros | 60.5 /100 | #169 | Good $101,170 |
| Slovaks | 58.8 /100 | #170 | Average $101,029 |
| South Americans | 56.4 /100 | #171 | Average $100,837 |
| Immigrants | Uzbekistan | 52.5 /100 | #172 | Average $100,523 |