Costa Rican vs Slovak In Labor Force | Age 45-54
COMPARE
Costa Rican
Slovak
In Labor Force | Age 45-54
In Labor Force | Age 45-54 Comparison
Costa Ricans
Slovaks
82.8%
IN LABOR FORCE | AGE 45-54
50.0/ 100
METRIC RATING
174th/ 347
METRIC RANK
83.2%
IN LABOR FORCE | AGE 45-54
92.8/ 100
METRIC RATING
108th/ 347
METRIC RANK
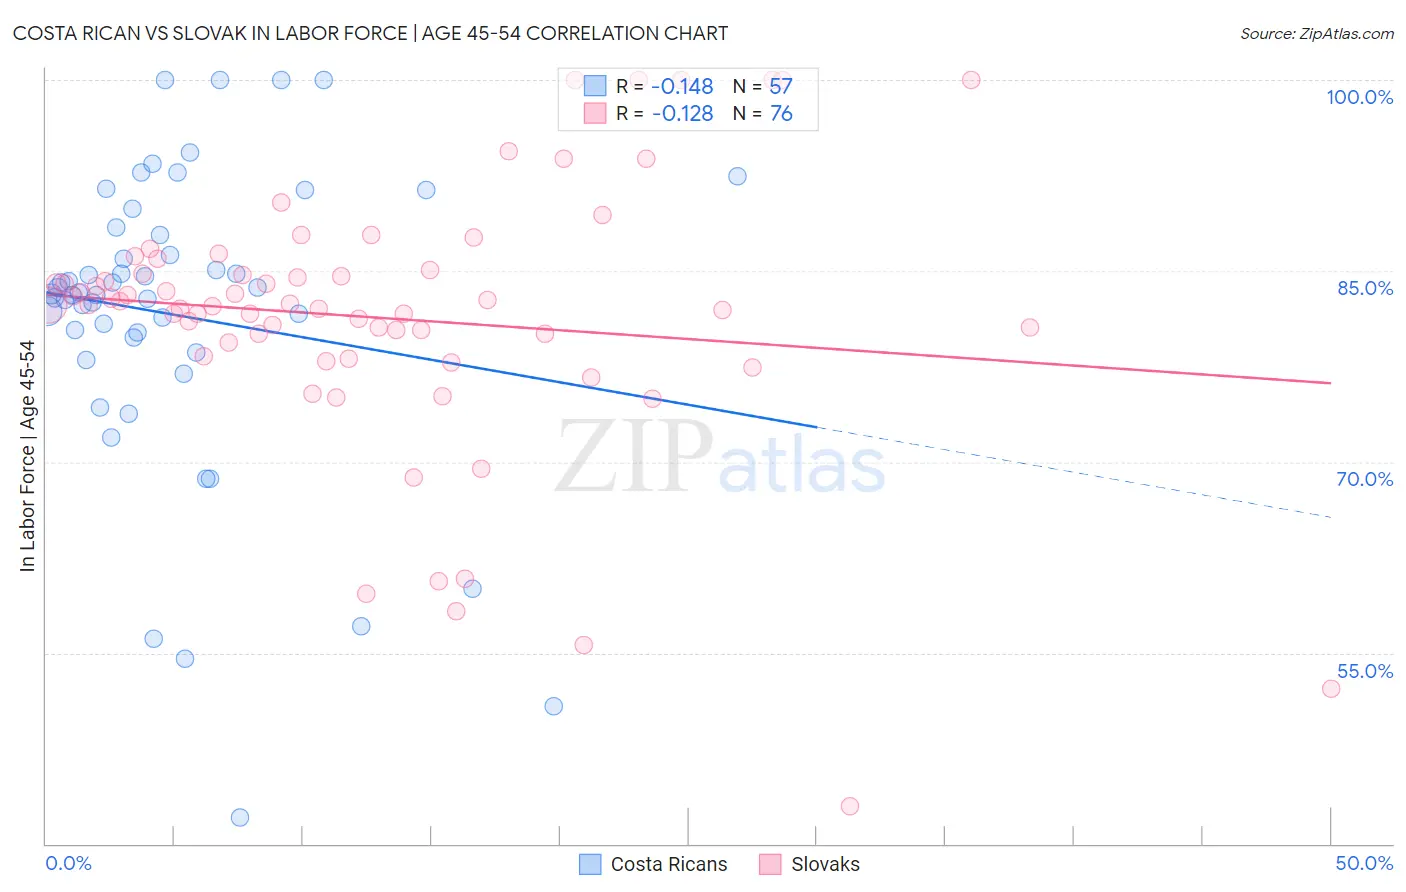
Costa Rican vs Slovak In Labor Force | Age 45-54 Correlation Chart
The statistical analysis conducted on geographies consisting of 253,468,855 people shows a poor negative correlation between the proportion of Costa Ricans and labor force participation rate among population between the ages 45 and 54 in the United States with a correlation coefficient (R) of -0.148 and weighted average of 82.8%. Similarly, the statistical analysis conducted on geographies consisting of 397,668,603 people shows a poor negative correlation between the proportion of Slovaks and labor force participation rate among population between the ages 45 and 54 in the United States with a correlation coefficient (R) of -0.128 and weighted average of 83.2%, a difference of 0.56%.
In Labor Force | Age 45-54 Correlation Summary
| Measurement | Costa Rican | Slovak |
| Minimum | 42.1% | 42.9% |
| Maximum | 100.0% | 100.0% |
| Range | 57.9% | 57.1% |
| Mean | 81.5% | 81.3% |
| Median | 83.2% | 82.4% |
| Interquartile 25% (IQ1) | 79.2% | 78.8% |
| Interquartile 75% (IQ3) | 88.1% | 84.9% |
| Interquartile Range (IQR) | 8.9% | 6.1% |
| Standard Deviation (Sample) | 12.1% | 10.6% |
| Standard Deviation (Population) | 12.0% | 10.5% |
Similar Demographics by In Labor Force | Age 45-54
Demographics Similar to Costa Ricans by In Labor Force | Age 45-54
In terms of in labor force | age 45-54, the demographic groups most similar to Costa Ricans are Nicaraguan (82.8%, a difference of 0.0%), Icelander (82.8%, a difference of 0.020%), Immigrants from Liberia (82.7%, a difference of 0.020%), Pakistani (82.8%, a difference of 0.030%), and Immigrants from Zaire (82.8%, a difference of 0.030%).
| Demographics | Rating | Rank | In Labor Force | Age 45-54 |
| Swiss | 56.5 /100 | #167 | Average 82.8% |
| Immigrants | South Africa | 55.8 /100 | #168 | Average 82.8% |
| Immigrants | Western Africa | 54.1 /100 | #169 | Average 82.8% |
| Pakistanis | 53.2 /100 | #170 | Average 82.8% |
| Immigrants | Zaire | 52.9 /100 | #171 | Average 82.8% |
| Icelanders | 51.8 /100 | #172 | Average 82.8% |
| Nicaraguans | 50.3 /100 | #173 | Average 82.8% |
| Costa Ricans | 50.0 /100 | #174 | Average 82.8% |
| Immigrants | Liberia | 47.9 /100 | #175 | Average 82.7% |
| Northern Europeans | 46.9 /100 | #176 | Average 82.7% |
| Immigrants | Nicaragua | 44.6 /100 | #177 | Average 82.7% |
| Nigerians | 40.5 /100 | #178 | Average 82.7% |
| Immigrants | Switzerland | 39.4 /100 | #179 | Fair 82.7% |
| Hungarians | 38.0 /100 | #180 | Fair 82.7% |
| Israelis | 37.7 /100 | #181 | Fair 82.7% |
Demographics Similar to Slovaks by In Labor Force | Age 45-54
In terms of in labor force | age 45-54, the demographic groups most similar to Slovaks are Iranian (83.2%, a difference of 0.0%), Ukrainian (83.2%, a difference of 0.0%), Immigrants from Africa (83.2%, a difference of 0.0%), Sri Lankan (83.2%, a difference of 0.010%), and Immigrants from Italy (83.2%, a difference of 0.010%).
| Demographics | Rating | Rank | In Labor Force | Age 45-54 |
| Immigrants | Belarus | 94.1 /100 | #101 | Exceptional 83.3% |
| Immigrants | Singapore | 93.9 /100 | #102 | Exceptional 83.3% |
| Albanians | 93.9 /100 | #103 | Exceptional 83.3% |
| Immigrants | Romania | 93.8 /100 | #104 | Exceptional 83.3% |
| Immigrants | South America | 93.5 /100 | #105 | Exceptional 83.2% |
| Sri Lankans | 93.2 /100 | #106 | Exceptional 83.2% |
| Iranians | 92.9 /100 | #107 | Exceptional 83.2% |
| Slovaks | 92.8 /100 | #108 | Exceptional 83.2% |
| Ukrainians | 92.7 /100 | #109 | Exceptional 83.2% |
| Immigrants | Africa | 92.6 /100 | #110 | Exceptional 83.2% |
| Immigrants | Italy | 92.5 /100 | #111 | Exceptional 83.2% |
| Immigrants | Afghanistan | 92.4 /100 | #112 | Exceptional 83.2% |
| Immigrants | Albania | 91.8 /100 | #113 | Exceptional 83.2% |
| Assyrians/Chaldeans/Syriacs | 91.7 /100 | #114 | Exceptional 83.2% |
| Immigrants | Chile | 91.6 /100 | #115 | Exceptional 83.2% |