Sudanese vs Immigrants from Vietnam Currently Married
COMPARE
Sudanese
Immigrants from Vietnam
Currently Married
Currently Married Comparison
Sudanese
Immigrants from Vietnam
43.7%
CURRENTLY MARRIED
0.1/ 100
METRIC RATING
264th/ 347
METRIC RANK
47.2%
CURRENTLY MARRIED
78.2/ 100
METRIC RATING
136th/ 347
METRIC RANK
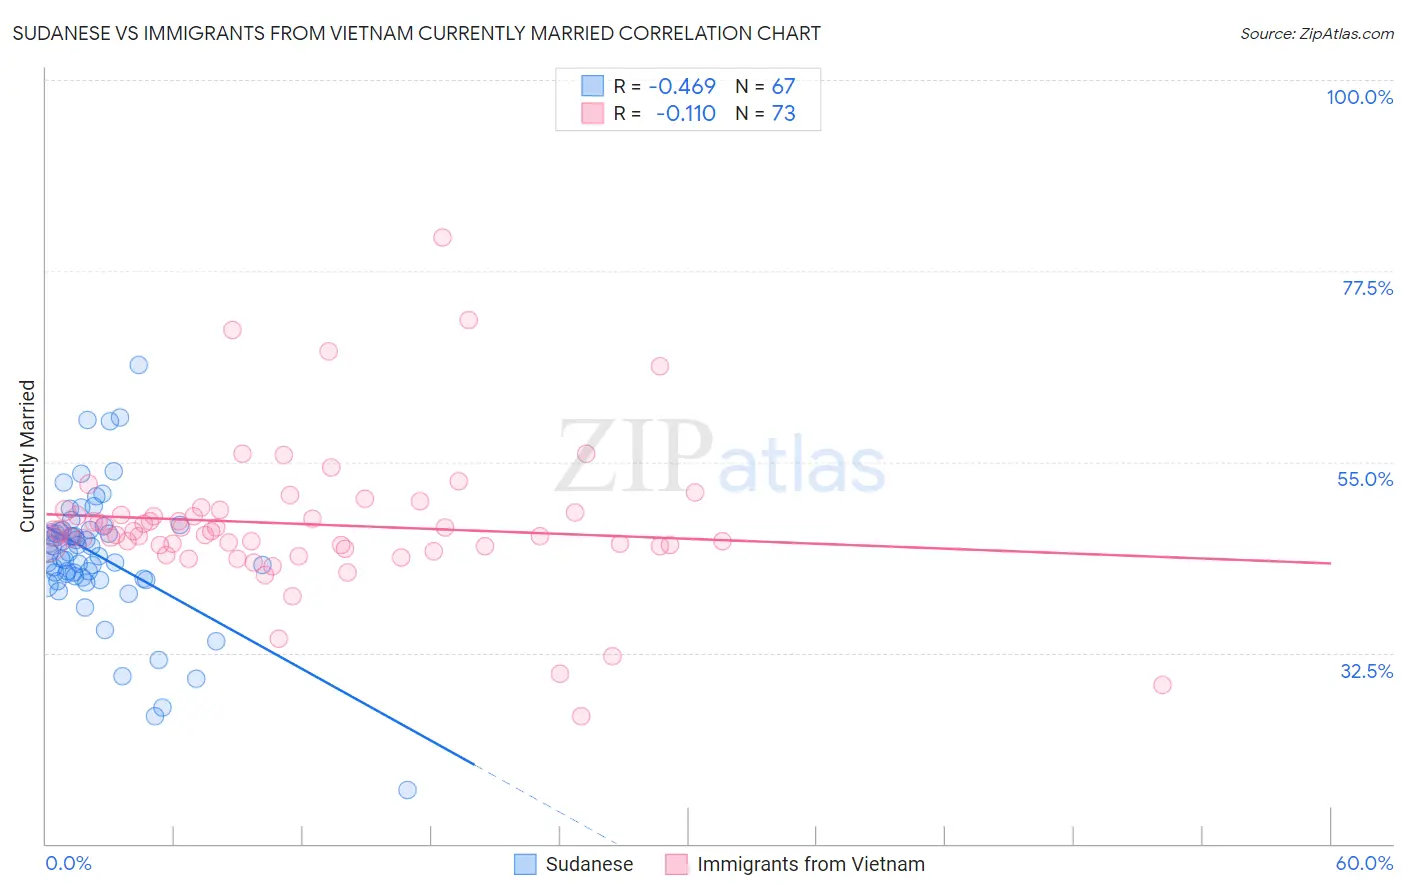
Sudanese vs Immigrants from Vietnam Currently Married Correlation Chart
The statistical analysis conducted on geographies consisting of 110,133,540 people shows a moderate negative correlation between the proportion of Sudanese and percentage of population currently married in the United States with a correlation coefficient (R) of -0.469 and weighted average of 43.7%. Similarly, the statistical analysis conducted on geographies consisting of 404,782,059 people shows a poor negative correlation between the proportion of Immigrants from Vietnam and percentage of population currently married in the United States with a correlation coefficient (R) of -0.110 and weighted average of 47.2%, a difference of 8.1%.
Currently Married Correlation Summary
| Measurement | Sudanese | Immigrants from Vietnam |
| Minimum | 16.3% | 25.0% |
| Maximum | 66.4% | 81.5% |
| Range | 50.1% | 56.5% |
| Mean | 43.9% | 47.7% |
| Median | 44.3% | 46.5% |
| Interquartile 25% (IQ1) | 41.3% | 45.0% |
| Interquartile 75% (IQ3) | 46.9% | 49.2% |
| Interquartile Range (IQR) | 5.6% | 4.1% |
| Standard Deviation (Sample) | 8.0% | 8.6% |
| Standard Deviation (Population) | 7.9% | 8.5% |
Similar Demographics by Currently Married
Demographics Similar to Sudanese by Currently Married
In terms of currently married, the demographic groups most similar to Sudanese are Immigrants from Cuba (43.7%, a difference of 0.010%), Bangladeshi (43.7%, a difference of 0.050%), Immigrants from Bangladesh (43.6%, a difference of 0.080%), Ecuadorian (43.6%, a difference of 0.15%), and Immigrants from Eritrea (43.6%, a difference of 0.18%).
| Demographics | Rating | Rank | Currently Married |
| Immigrants | Africa | 0.2 /100 | #257 | Tragic 43.9% |
| Ute | 0.2 /100 | #258 | Tragic 43.9% |
| Immigrants | Sierra Leone | 0.1 /100 | #259 | Tragic 43.8% |
| Immigrants | Latin America | 0.1 /100 | #260 | Tragic 43.8% |
| Immigrants | Nicaragua | 0.1 /100 | #261 | Tragic 43.7% |
| Bangladeshis | 0.1 /100 | #262 | Tragic 43.7% |
| Immigrants | Cuba | 0.1 /100 | #263 | Tragic 43.7% |
| Sudanese | 0.1 /100 | #264 | Tragic 43.7% |
| Immigrants | Bangladesh | 0.1 /100 | #265 | Tragic 43.6% |
| Ecuadorians | 0.1 /100 | #266 | Tragic 43.6% |
| Immigrants | Eritrea | 0.1 /100 | #267 | Tragic 43.6% |
| Spanish American Indians | 0.1 /100 | #268 | Tragic 43.6% |
| Immigrants | Sudan | 0.1 /100 | #269 | Tragic 43.5% |
| Salvadorans | 0.1 /100 | #270 | Tragic 43.5% |
| Bermudans | 0.1 /100 | #271 | Tragic 43.5% |
Demographics Similar to Immigrants from Vietnam by Currently Married
In terms of currently married, the demographic groups most similar to Immigrants from Vietnam are Paraguayan (47.2%, a difference of 0.020%), Pakistani (47.2%, a difference of 0.040%), Yugoslavian (47.2%, a difference of 0.040%), Immigrants from Norway (47.2%, a difference of 0.080%), and Cajun (47.1%, a difference of 0.15%).
| Demographics | Rating | Rank | Currently Married |
| Sri Lankans | 83.2 /100 | #129 | Excellent 47.3% |
| Immigrants | Iraq | 82.8 /100 | #130 | Excellent 47.3% |
| Icelanders | 82.4 /100 | #131 | Excellent 47.3% |
| Afghans | 81.8 /100 | #132 | Excellent 47.3% |
| Immigrants | Malaysia | 81.1 /100 | #133 | Excellent 47.3% |
| Immigrants | Australia | 81.1 /100 | #134 | Excellent 47.3% |
| Immigrants | Norway | 79.7 /100 | #135 | Good 47.2% |
| Immigrants | Vietnam | 78.2 /100 | #136 | Good 47.2% |
| Paraguayans | 77.8 /100 | #137 | Good 47.2% |
| Pakistanis | 77.5 /100 | #138 | Good 47.2% |
| Yugoslavians | 77.4 /100 | #139 | Good 47.2% |
| Cajuns | 75.3 /100 | #140 | Good 47.1% |
| Venezuelans | 74.4 /100 | #141 | Good 47.1% |
| Argentineans | 74.4 /100 | #142 | Good 47.1% |
| Guamanians/Chamorros | 74.2 /100 | #143 | Good 47.1% |