Colville vs German Family Households
COMPARE
Colville
German
Family Households
Family Households Comparison
Colville
Germans
63.2%
FAMILY HOUSEHOLDS
0.5/ 100
METRIC RATING
265th/ 347
METRIC RANK
64.4%
FAMILY HOUSEHOLDS
65.8/ 100
METRIC RATING
159th/ 347
METRIC RANK
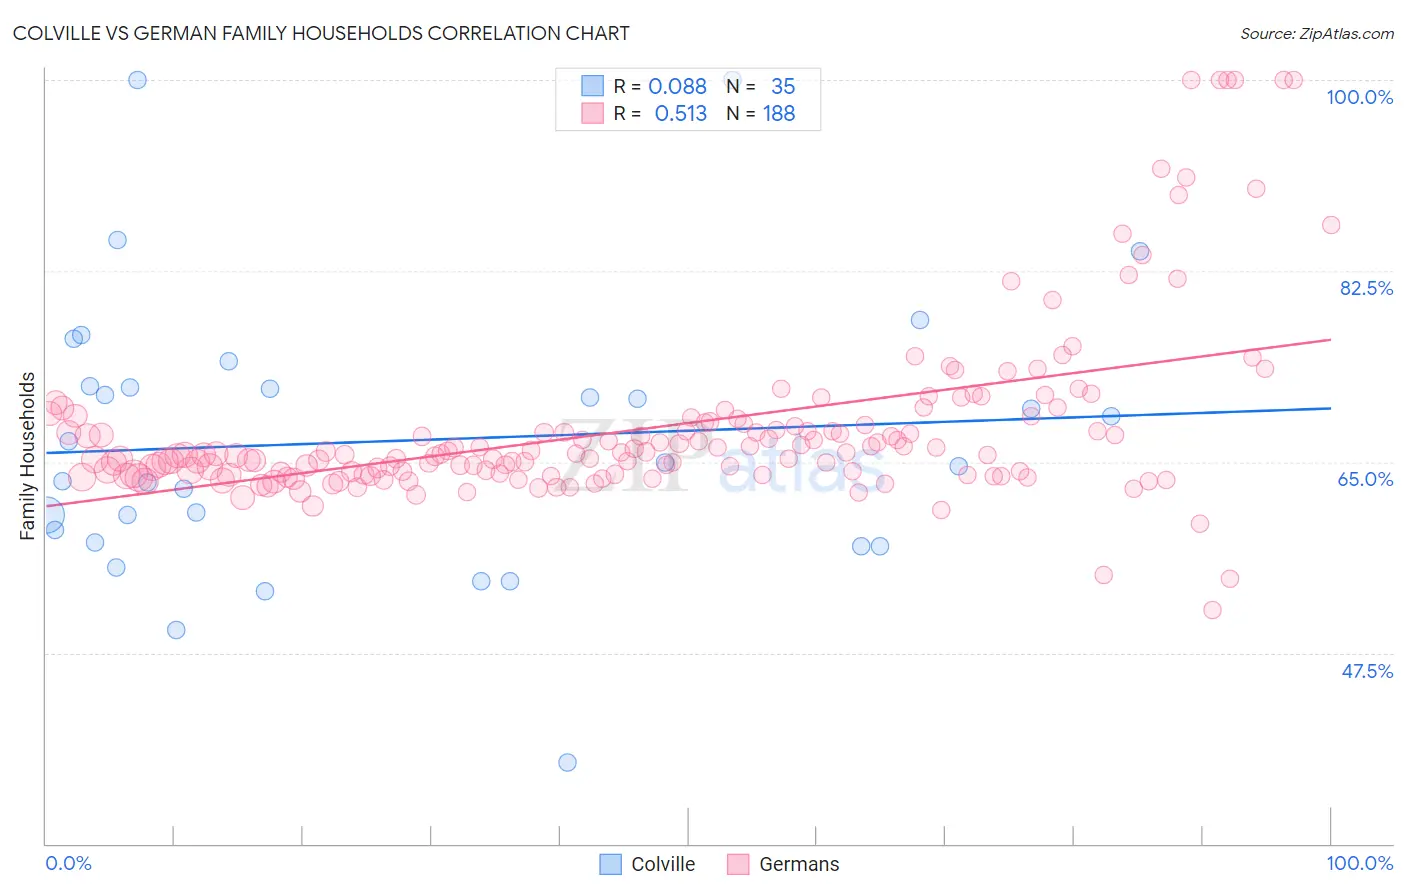
Colville vs German Family Households Correlation Chart
The statistical analysis conducted on geographies consisting of 34,683,092 people shows a slight positive correlation between the proportion of Colville and percentage of family households in the United States with a correlation coefficient (R) of 0.088 and weighted average of 63.2%. Similarly, the statistical analysis conducted on geographies consisting of 580,609,417 people shows a substantial positive correlation between the proportion of Germans and percentage of family households in the United States with a correlation coefficient (R) of 0.513 and weighted average of 64.4%, a difference of 2.0%.
Family Households Correlation Summary
| Measurement | Colville | German |
| Minimum | 37.5% | 51.4% |
| Maximum | 100.0% | 100.0% |
| Range | 62.5% | 48.6% |
| Mean | 66.9% | 68.1% |
| Median | 65.0% | 65.7% |
| Interquartile 25% (IQ1) | 57.6% | 63.9% |
| Interquartile 75% (IQ3) | 72.0% | 68.5% |
| Interquartile Range (IQR) | 14.4% | 4.7% |
| Standard Deviation (Sample) | 12.9% | 8.2% |
| Standard Deviation (Population) | 12.7% | 8.2% |
Similar Demographics by Family Households
Demographics Similar to Colville by Family Households
In terms of family households, the demographic groups most similar to Colville are Kenyan (63.2%, a difference of 0.010%), Immigrants from Western Africa (63.1%, a difference of 0.010%), Cheyenne (63.2%, a difference of 0.020%), Immigrants from Ireland (63.2%, a difference of 0.040%), and Immigrants from Russia (63.2%, a difference of 0.050%).
| Demographics | Rating | Rank | Family Households |
| Immigrants | Barbados | 0.7 /100 | #258 | Tragic 63.2% |
| Immigrants | Western Europe | 0.6 /100 | #259 | Tragic 63.2% |
| Cypriots | 0.6 /100 | #260 | Tragic 63.2% |
| Immigrants | Russia | 0.6 /100 | #261 | Tragic 63.2% |
| Immigrants | Ireland | 0.6 /100 | #262 | Tragic 63.2% |
| Cheyenne | 0.5 /100 | #263 | Tragic 63.2% |
| Kenyans | 0.5 /100 | #264 | Tragic 63.2% |
| Colville | 0.5 /100 | #265 | Tragic 63.2% |
| Immigrants | Western Africa | 0.5 /100 | #266 | Tragic 63.1% |
| Israelis | 0.4 /100 | #267 | Tragic 63.1% |
| Immigrants | Singapore | 0.4 /100 | #268 | Tragic 63.1% |
| Yugoslavians | 0.4 /100 | #269 | Tragic 63.1% |
| Immigrants | Austria | 0.3 /100 | #270 | Tragic 63.1% |
| Immigrants | Croatia | 0.3 /100 | #271 | Tragic 63.1% |
| Immigrants | Turkey | 0.3 /100 | #272 | Tragic 63.1% |
Demographics Similar to Germans by Family Households
In terms of family households, the demographic groups most similar to Germans are Canadian (64.4%, a difference of 0.010%), Lebanese (64.4%, a difference of 0.010%), Immigrants from Moldova (64.4%, a difference of 0.010%), Czech (64.5%, a difference of 0.020%), and Uruguayan (64.5%, a difference of 0.030%).
| Demographics | Rating | Rank | Family Households |
| Scottish | 70.9 /100 | #152 | Good 64.5% |
| Swedes | 69.8 /100 | #153 | Good 64.5% |
| Austrians | 68.5 /100 | #154 | Good 64.5% |
| Uruguayans | 67.7 /100 | #155 | Good 64.5% |
| Czechs | 67.0 /100 | #156 | Good 64.5% |
| Canadians | 66.6 /100 | #157 | Good 64.4% |
| Lebanese | 66.4 /100 | #158 | Good 64.4% |
| Germans | 65.8 /100 | #159 | Good 64.4% |
| Immigrants | Moldova | 65.2 /100 | #160 | Good 64.4% |
| Immigrants | England | 62.6 /100 | #161 | Good 64.4% |
| British | 61.6 /100 | #162 | Good 64.4% |
| Chickasaw | 61.5 /100 | #163 | Good 64.4% |
| Immigrants | Nigeria | 60.1 /100 | #164 | Good 64.4% |
| Immigrants | Southern Europe | 60.0 /100 | #165 | Good 64.4% |
| Scotch-Irish | 59.2 /100 | #166 | Average 64.4% |