Colville vs Burmese Family Households
COMPARE
Colville
Burmese
Family Households
Family Households Comparison
Colville
Burmese
63.2%
FAMILY HOUSEHOLDS
0.5/ 100
METRIC RATING
265th/ 347
METRIC RANK
65.7%
FAMILY HOUSEHOLDS
99.9/ 100
METRIC RATING
74th/ 347
METRIC RANK
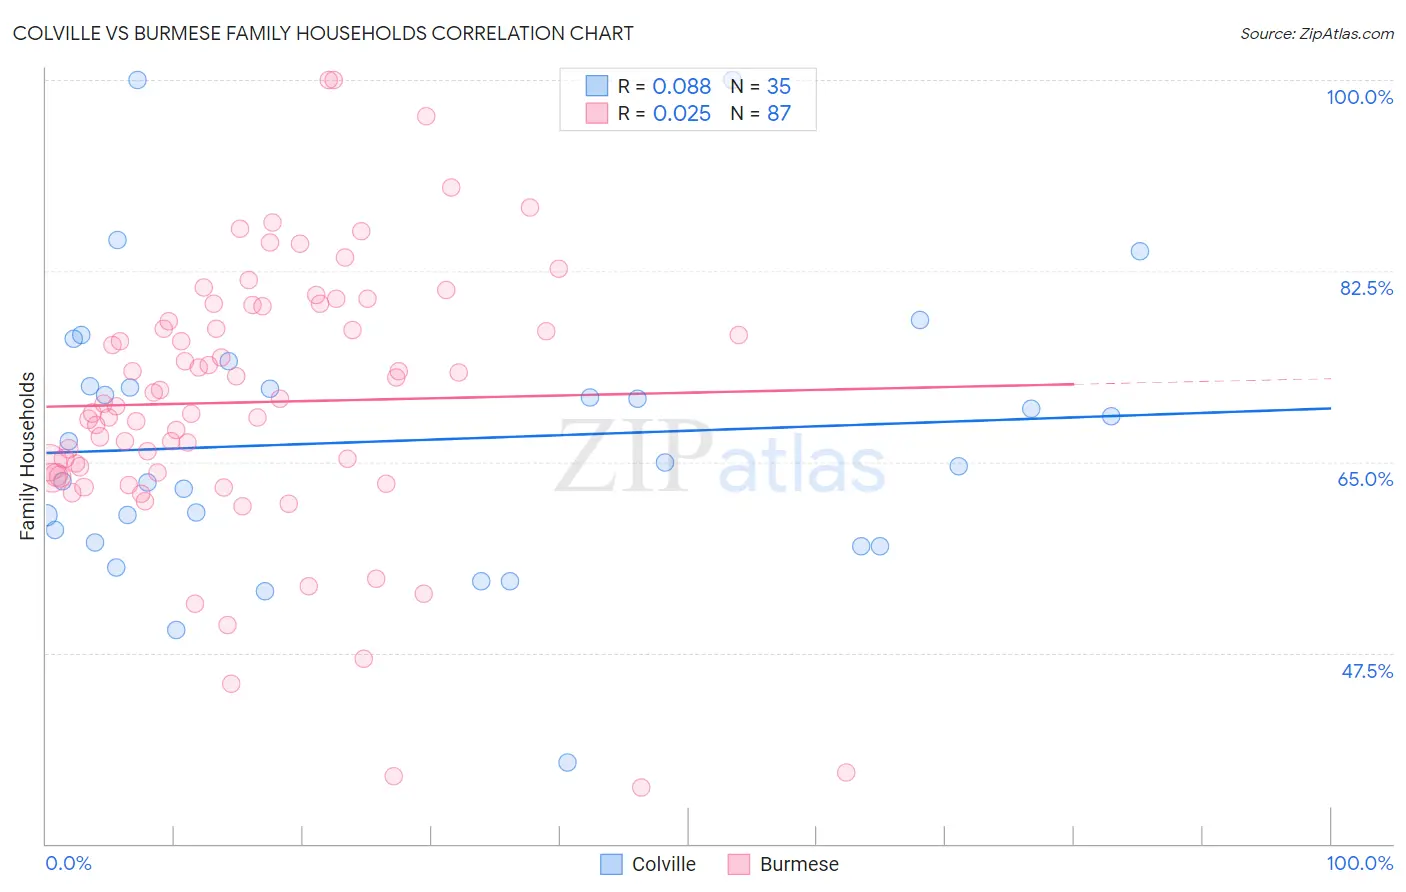
Colville vs Burmese Family Households Correlation Chart
The statistical analysis conducted on geographies consisting of 34,683,092 people shows a slight positive correlation between the proportion of Colville and percentage of family households in the United States with a correlation coefficient (R) of 0.088 and weighted average of 63.2%. Similarly, the statistical analysis conducted on geographies consisting of 464,897,249 people shows no correlation between the proportion of Burmese and percentage of family households in the United States with a correlation coefficient (R) of 0.025 and weighted average of 65.7%, a difference of 4.1%.
Family Households Correlation Summary
| Measurement | Colville | Burmese |
| Minimum | 37.5% | 35.2% |
| Maximum | 100.0% | 100.0% |
| Range | 62.5% | 64.8% |
| Mean | 66.9% | 70.5% |
| Median | 65.0% | 70.3% |
| Interquartile 25% (IQ1) | 57.6% | 63.8% |
| Interquartile 75% (IQ3) | 72.0% | 79.2% |
| Interquartile Range (IQR) | 14.4% | 15.4% |
| Standard Deviation (Sample) | 12.9% | 12.5% |
| Standard Deviation (Population) | 12.7% | 12.5% |
Similar Demographics by Family Households
Demographics Similar to Colville by Family Households
In terms of family households, the demographic groups most similar to Colville are Kenyan (63.2%, a difference of 0.010%), Immigrants from Western Africa (63.1%, a difference of 0.010%), Cheyenne (63.2%, a difference of 0.020%), Immigrants from Ireland (63.2%, a difference of 0.040%), and Immigrants from Russia (63.2%, a difference of 0.050%).
| Demographics | Rating | Rank | Family Households |
| Immigrants | Barbados | 0.7 /100 | #258 | Tragic 63.2% |
| Immigrants | Western Europe | 0.6 /100 | #259 | Tragic 63.2% |
| Cypriots | 0.6 /100 | #260 | Tragic 63.2% |
| Immigrants | Russia | 0.6 /100 | #261 | Tragic 63.2% |
| Immigrants | Ireland | 0.6 /100 | #262 | Tragic 63.2% |
| Cheyenne | 0.5 /100 | #263 | Tragic 63.2% |
| Kenyans | 0.5 /100 | #264 | Tragic 63.2% |
| Colville | 0.5 /100 | #265 | Tragic 63.2% |
| Immigrants | Western Africa | 0.5 /100 | #266 | Tragic 63.1% |
| Israelis | 0.4 /100 | #267 | Tragic 63.1% |
| Immigrants | Singapore | 0.4 /100 | #268 | Tragic 63.1% |
| Yugoslavians | 0.4 /100 | #269 | Tragic 63.1% |
| Immigrants | Austria | 0.3 /100 | #270 | Tragic 63.1% |
| Immigrants | Croatia | 0.3 /100 | #271 | Tragic 63.1% |
| Immigrants | Turkey | 0.3 /100 | #272 | Tragic 63.1% |
Demographics Similar to Burmese by Family Households
In terms of family households, the demographic groups most similar to Burmese are Laotian (65.8%, a difference of 0.040%), Houma (65.7%, a difference of 0.050%), Portuguese (65.8%, a difference of 0.11%), Bhutanese (65.9%, a difference of 0.16%), and Immigrants from the Azores (65.6%, a difference of 0.17%).
| Demographics | Rating | Rank | Family Households |
| Filipinos | 99.9 /100 | #67 | Exceptional 65.9% |
| Japanese | 99.9 /100 | #68 | Exceptional 65.9% |
| Malaysians | 99.9 /100 | #69 | Exceptional 65.9% |
| Immigrants | Afghanistan | 99.9 /100 | #70 | Exceptional 65.9% |
| Bhutanese | 99.9 /100 | #71 | Exceptional 65.9% |
| Portuguese | 99.9 /100 | #72 | Exceptional 65.8% |
| Laotians | 99.9 /100 | #73 | Exceptional 65.8% |
| Burmese | 99.9 /100 | #74 | Exceptional 65.7% |
| Houma | 99.9 /100 | #75 | Exceptional 65.7% |
| Immigrants | Azores | 99.8 /100 | #76 | Exceptional 65.6% |
| Immigrants | South America | 99.8 /100 | #77 | Exceptional 65.6% |
| Yaqui | 99.8 /100 | #78 | Exceptional 65.6% |
| Immigrants | Costa Rica | 99.8 /100 | #79 | Exceptional 65.6% |
| Puget Sound Salish | 99.8 /100 | #80 | Exceptional 65.6% |
| Jordanians | 99.7 /100 | #81 | Exceptional 65.5% |