Colville vs Immigrants from Asia Married-couple Households
COMPARE
Colville
Immigrants from Asia
Married-couple Households
Married-couple Households Comparison
Colville
Immigrants from Asia
41.0%
MARRIED-COUPLE HOUSEHOLDS
0.0/ 100
METRIC RATING
311th/ 347
METRIC RANK
49.1%
MARRIED-COUPLE HOUSEHOLDS
99.7/ 100
METRIC RATING
33rd/ 347
METRIC RANK
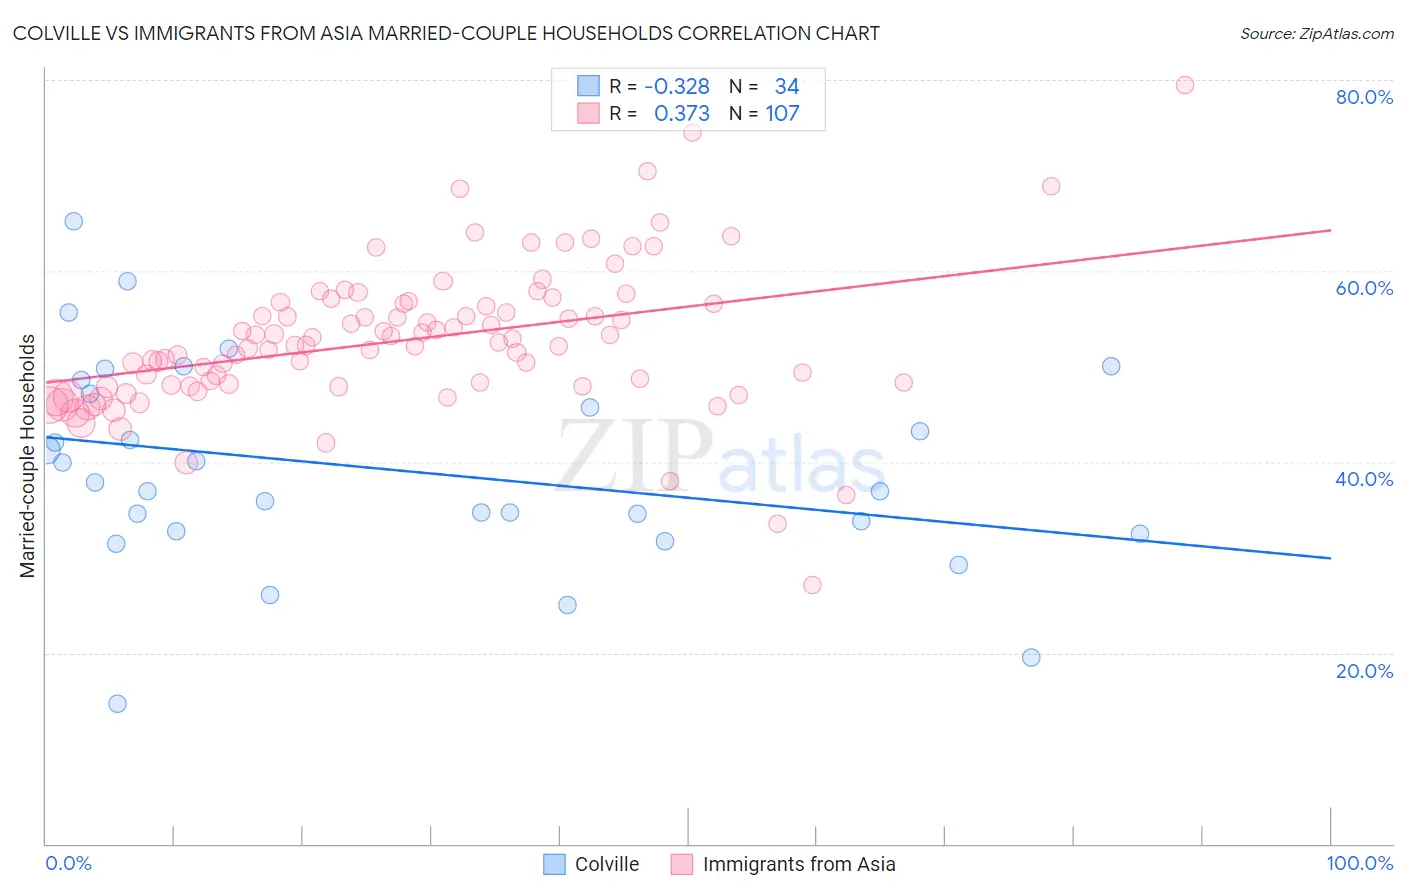
Colville vs Immigrants from Asia Married-couple Households Correlation Chart
The statistical analysis conducted on geographies consisting of 34,682,856 people shows a mild negative correlation between the proportion of Colville and percentage of married-couple family households in the United States with a correlation coefficient (R) of -0.328 and weighted average of 41.0%. Similarly, the statistical analysis conducted on geographies consisting of 548,508,948 people shows a mild positive correlation between the proportion of Immigrants from Asia and percentage of married-couple family households in the United States with a correlation coefficient (R) of 0.373 and weighted average of 49.1%, a difference of 19.7%.
Married-couple Households Correlation Summary
| Measurement | Colville | Immigrants from Asia |
| Minimum | 14.7% | 27.1% |
| Maximum | 65.2% | 79.5% |
| Range | 50.6% | 52.3% |
| Mean | 39.2% | 52.8% |
| Median | 37.4% | 52.2% |
| Interquartile 25% (IQ1) | 32.8% | 47.9% |
| Interquartile 75% (IQ3) | 47.2% | 56.6% |
| Interquartile Range (IQR) | 14.4% | 8.7% |
| Standard Deviation (Sample) | 10.8% | 7.7% |
| Standard Deviation (Population) | 10.7% | 7.7% |
Similar Demographics by Married-couple Households
Demographics Similar to Colville by Married-couple Households
In terms of married-couple households, the demographic groups most similar to Colville are African (40.9%, a difference of 0.090%), Immigrants from Haiti (40.9%, a difference of 0.15%), Jamaican (40.9%, a difference of 0.22%), Trinidadian and Tobagonian (40.9%, a difference of 0.30%), and Immigrants from Caribbean (40.8%, a difference of 0.49%).
| Demographics | Rating | Rank | Married-couple Households |
| Immigrants | Guyana | 0.0 /100 | #304 | Tragic 41.6% |
| Sioux | 0.0 /100 | #305 | Tragic 41.5% |
| Guyanese | 0.0 /100 | #306 | Tragic 41.4% |
| Immigrants | Western Africa | 0.0 /100 | #307 | Tragic 41.4% |
| Crow | 0.0 /100 | #308 | Tragic 41.4% |
| Immigrants | Trinidad and Tobago | 0.0 /100 | #309 | Tragic 41.2% |
| Haitians | 0.0 /100 | #310 | Tragic 41.2% |
| Colville | 0.0 /100 | #311 | Tragic 41.0% |
| Africans | 0.0 /100 | #312 | Tragic 40.9% |
| Immigrants | Haiti | 0.0 /100 | #313 | Tragic 40.9% |
| Jamaicans | 0.0 /100 | #314 | Tragic 40.9% |
| Trinidadians and Tobagonians | 0.0 /100 | #315 | Tragic 40.9% |
| Immigrants | Caribbean | 0.0 /100 | #316 | Tragic 40.8% |
| Immigrants | Jamaica | 0.0 /100 | #317 | Tragic 40.7% |
| Liberians | 0.0 /100 | #318 | Tragic 40.7% |
Demographics Similar to Immigrants from Asia by Married-couple Households
In terms of married-couple households, the demographic groups most similar to Immigrants from Asia are Hungarian (49.1%, a difference of 0.030%), Italian (49.0%, a difference of 0.080%), Native Hawaiian (49.1%, a difference of 0.090%), Scottish (49.0%, a difference of 0.10%), and Iranian (49.0%, a difference of 0.19%).
| Demographics | Rating | Rank | Married-couple Households |
| Immigrants | Scotland | 99.8 /100 | #26 | Exceptional 49.3% |
| Bhutanese | 99.8 /100 | #27 | Exceptional 49.3% |
| Germans | 99.8 /100 | #28 | Exceptional 49.2% |
| Maltese | 99.8 /100 | #29 | Exceptional 49.2% |
| Bolivians | 99.8 /100 | #30 | Exceptional 49.2% |
| Native Hawaiians | 99.8 /100 | #31 | Exceptional 49.1% |
| Hungarians | 99.8 /100 | #32 | Exceptional 49.1% |
| Immigrants | Asia | 99.7 /100 | #33 | Exceptional 49.1% |
| Italians | 99.7 /100 | #34 | Exceptional 49.0% |
| Scottish | 99.7 /100 | #35 | Exceptional 49.0% |
| Iranians | 99.7 /100 | #36 | Exceptional 49.0% |
| Sri Lankans | 99.7 /100 | #37 | Exceptional 49.0% |
| Greeks | 99.7 /100 | #38 | Exceptional 48.9% |
| Lithuanians | 99.6 /100 | #39 | Exceptional 48.9% |
| Immigrants | Bolivia | 99.6 /100 | #40 | Exceptional 48.9% |