Colville vs Immigrants from Ethiopia Married-couple Households
COMPARE
Colville
Immigrants from Ethiopia
Married-couple Households
Married-couple Households Comparison
Colville
Immigrants from Ethiopia
41.0%
MARRIED-COUPLE HOUSEHOLDS
0.0/ 100
METRIC RATING
311th/ 347
METRIC RANK
43.1%
MARRIED-COUPLE HOUSEHOLDS
0.0/ 100
METRIC RATING
276th/ 347
METRIC RANK
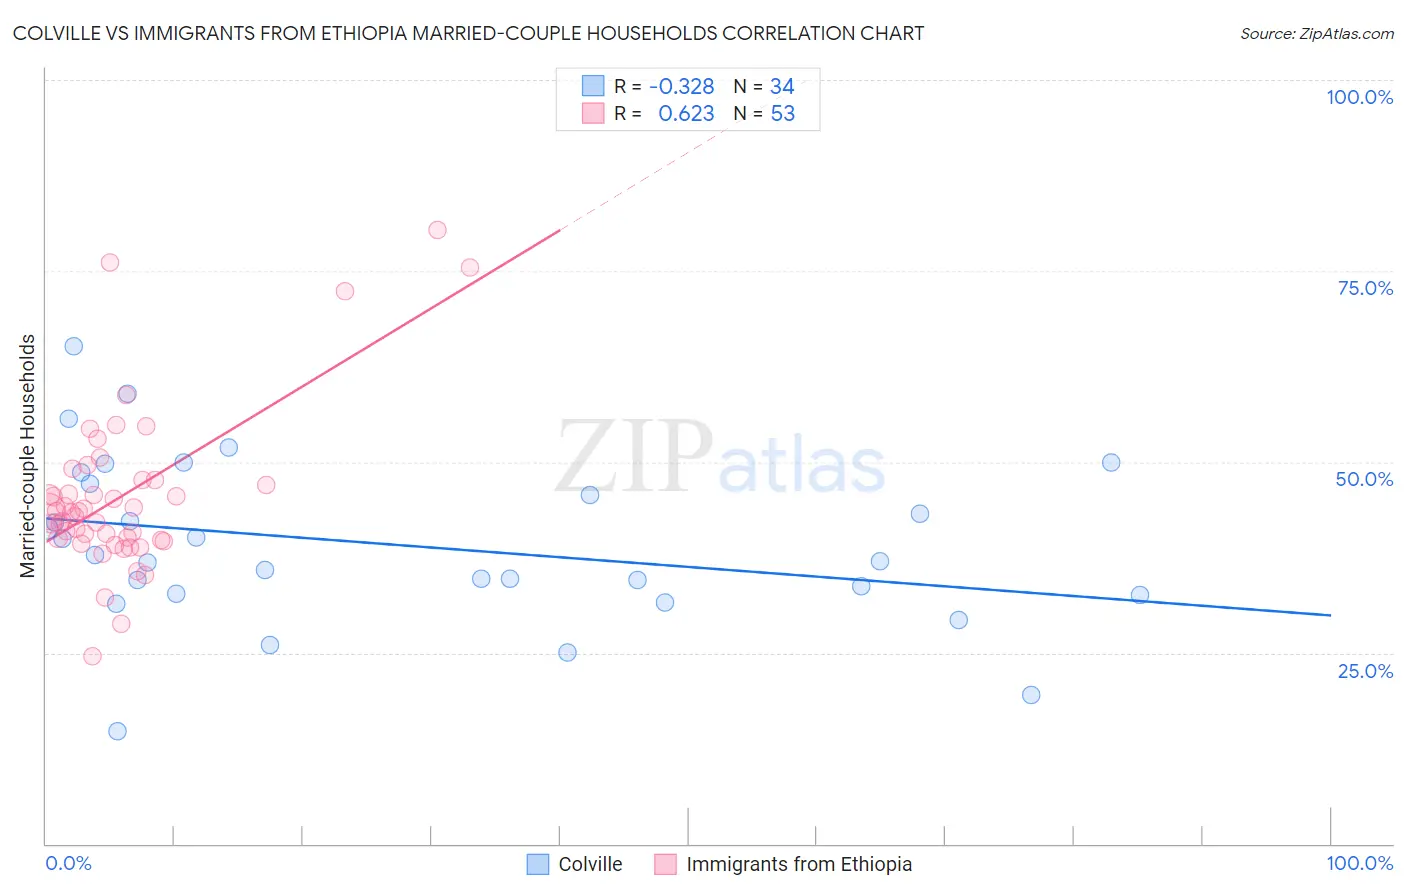
Colville vs Immigrants from Ethiopia Married-couple Households Correlation Chart
The statistical analysis conducted on geographies consisting of 34,682,856 people shows a mild negative correlation between the proportion of Colville and percentage of married-couple family households in the United States with a correlation coefficient (R) of -0.328 and weighted average of 41.0%. Similarly, the statistical analysis conducted on geographies consisting of 211,463,279 people shows a significant positive correlation between the proportion of Immigrants from Ethiopia and percentage of married-couple family households in the United States with a correlation coefficient (R) of 0.623 and weighted average of 43.1%, a difference of 5.1%.
Married-couple Households Correlation Summary
| Measurement | Colville | Immigrants from Ethiopia |
| Minimum | 14.7% | 24.6% |
| Maximum | 65.2% | 80.4% |
| Range | 50.6% | 55.7% |
| Mean | 39.2% | 45.5% |
| Median | 37.4% | 43.5% |
| Interquartile 25% (IQ1) | 32.8% | 39.9% |
| Interquartile 75% (IQ3) | 47.2% | 47.7% |
| Interquartile Range (IQR) | 14.4% | 7.8% |
| Standard Deviation (Sample) | 10.8% | 10.7% |
| Standard Deviation (Population) | 10.7% | 10.6% |
Similar Demographics by Married-couple Households
Demographics Similar to Colville by Married-couple Households
In terms of married-couple households, the demographic groups most similar to Colville are African (40.9%, a difference of 0.090%), Immigrants from Haiti (40.9%, a difference of 0.15%), Jamaican (40.9%, a difference of 0.22%), Trinidadian and Tobagonian (40.9%, a difference of 0.30%), and Immigrants from Caribbean (40.8%, a difference of 0.49%).
| Demographics | Rating | Rank | Married-couple Households |
| Immigrants | Guyana | 0.0 /100 | #304 | Tragic 41.6% |
| Sioux | 0.0 /100 | #305 | Tragic 41.5% |
| Guyanese | 0.0 /100 | #306 | Tragic 41.4% |
| Immigrants | Western Africa | 0.0 /100 | #307 | Tragic 41.4% |
| Crow | 0.0 /100 | #308 | Tragic 41.4% |
| Immigrants | Trinidad and Tobago | 0.0 /100 | #309 | Tragic 41.2% |
| Haitians | 0.0 /100 | #310 | Tragic 41.2% |
| Colville | 0.0 /100 | #311 | Tragic 41.0% |
| Africans | 0.0 /100 | #312 | Tragic 40.9% |
| Immigrants | Haiti | 0.0 /100 | #313 | Tragic 40.9% |
| Jamaicans | 0.0 /100 | #314 | Tragic 40.9% |
| Trinidadians and Tobagonians | 0.0 /100 | #315 | Tragic 40.9% |
| Immigrants | Caribbean | 0.0 /100 | #316 | Tragic 40.8% |
| Immigrants | Jamaica | 0.0 /100 | #317 | Tragic 40.7% |
| Liberians | 0.0 /100 | #318 | Tragic 40.7% |
Demographics Similar to Immigrants from Ethiopia by Married-couple Households
In terms of married-couple households, the demographic groups most similar to Immigrants from Ethiopia are Immigrants from Bangladesh (43.1%, a difference of 0.11%), Nigerian (43.2%, a difference of 0.25%), Ethiopian (43.2%, a difference of 0.26%), Immigrants from Eastern Africa (42.9%, a difference of 0.26%), and Immigrants from Nigeria (43.2%, a difference of 0.36%).
| Demographics | Rating | Rank | Married-couple Households |
| Immigrants | Sierra Leone | 0.1 /100 | #269 | Tragic 43.3% |
| Yuman | 0.1 /100 | #270 | Tragic 43.3% |
| Guatemalans | 0.1 /100 | #271 | Tragic 43.3% |
| Immigrants | Nigeria | 0.1 /100 | #272 | Tragic 43.2% |
| Ethiopians | 0.1 /100 | #273 | Tragic 43.2% |
| Nigerians | 0.1 /100 | #274 | Tragic 43.2% |
| Immigrants | Bangladesh | 0.0 /100 | #275 | Tragic 43.1% |
| Immigrants | Ethiopia | 0.0 /100 | #276 | Tragic 43.1% |
| Immigrants | Eastern Africa | 0.0 /100 | #277 | Tragic 42.9% |
| Immigrants | Africa | 0.0 /100 | #278 | Tragic 42.9% |
| Sierra Leoneans | 0.0 /100 | #279 | Tragic 42.9% |
| Immigrants | Ecuador | 0.0 /100 | #280 | Tragic 42.9% |
| Immigrants | Guatemala | 0.0 /100 | #281 | Tragic 42.8% |
| Bermudans | 0.0 /100 | #282 | Tragic 42.4% |
| Inupiat | 0.0 /100 | #283 | Tragic 42.4% |